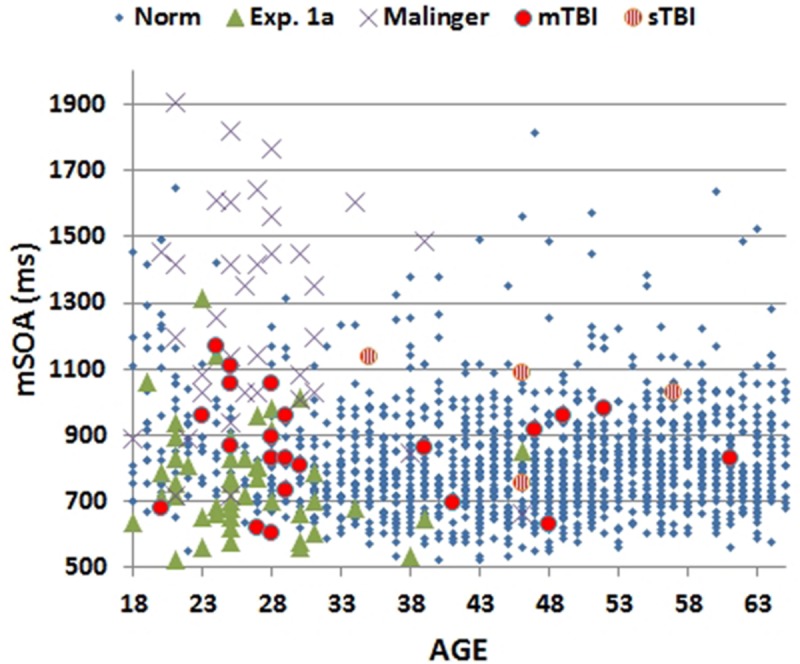
FIGURE 3.

Minimal stimulus onset asynchronies (mSOA) for subjects as a function of age. Showing data from the normative study (Norm), Experiment 1A, Experiment 2 (Malinger), and Experiment 3 (TBI). mSOAs for patients with mild TBI (mTBI, filled red circles) and severe TBI (sTBI, circles with vertical red stripes) are shown separately.
