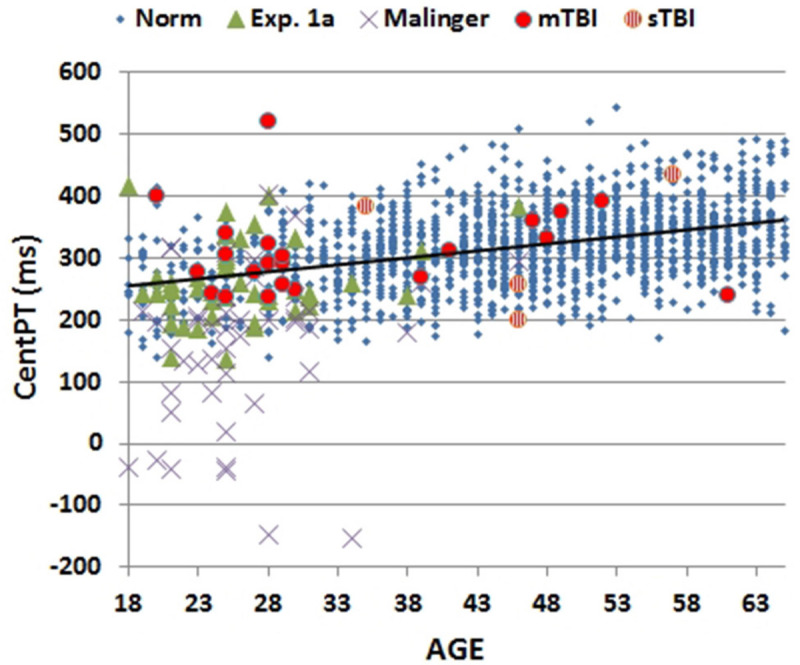
FIGURE 4.

Mean central processing times (CentPT) as a function of age. CentPTs were averaged over stimulus types from control subjects in the normative study (Norm) and Experiment 1A, simulated malingerers (Experiment 2), and TBI patients (Experiment 3). The age-regression slope for the normative data is shown. The results from patients with mild TBI (mTBI, filled red circles) and severe TBI (sTBI, circles with vertical red stripes) are shown separately.
