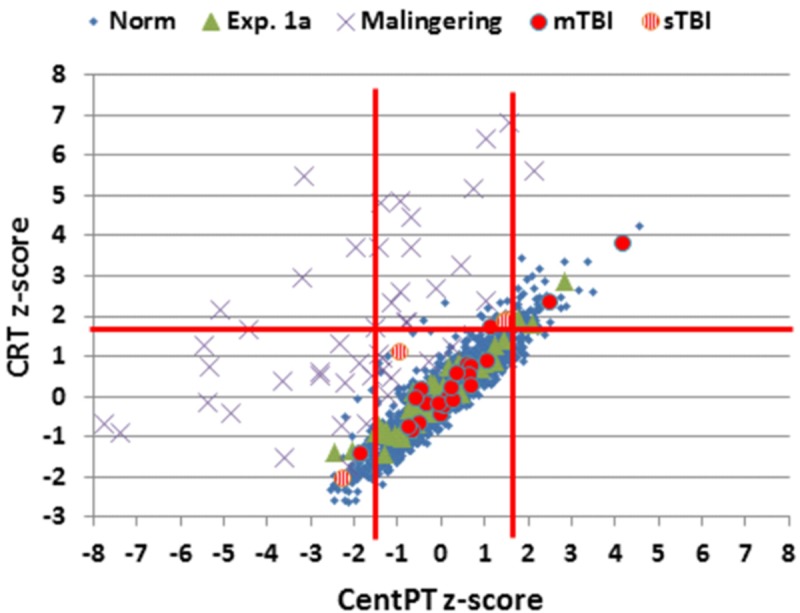
FIGURE 7.

Z-scores for CentPT (central processing time) and CRT. Data from controls in the normative study (Norm) and Experiment 1A, simulated malingerers, and patients with mild TBI (mTBI, filled red circles) and severe TBI (sTBI, circles with vertical red stripes). Z-scores were calculated using the age- and computer-use regression slopes from the normative data. The solid vertical red lines show limits for abnormally (p < 0.05) short and long CPTs.
