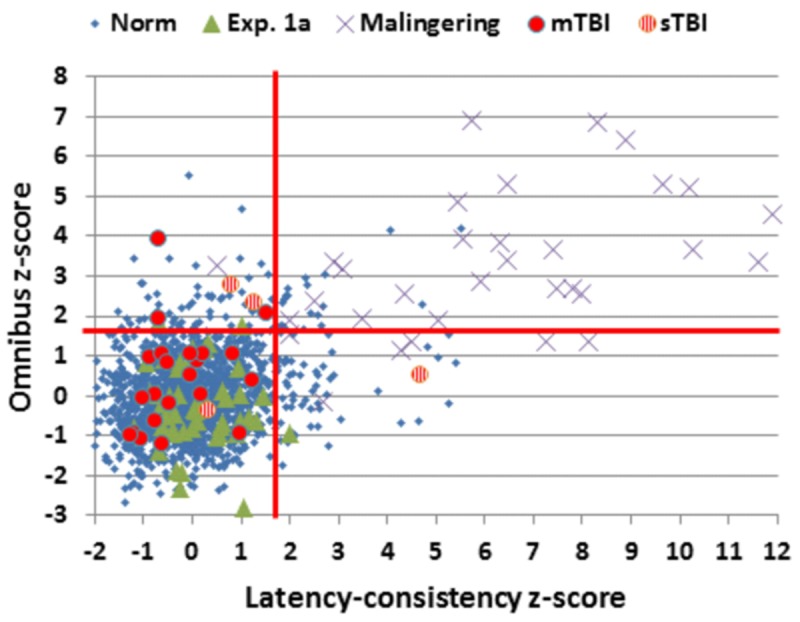
FIGURE 8.

Latency-consistency and Omnibus z-scores. Data are shown from control subjects in the normative population (Norm) and Experiment 1A, simulated malingerers, and patients with mild TBI (mTBI, filled red circles) and severe TBI (sTBI, circles with vertical red stripes). The red lines show abnormality cutoffs (p < 0.05) based on the normative population. The data from 13 malingering subjects with latency-consistency z-scores > 12.0 are not shown.
