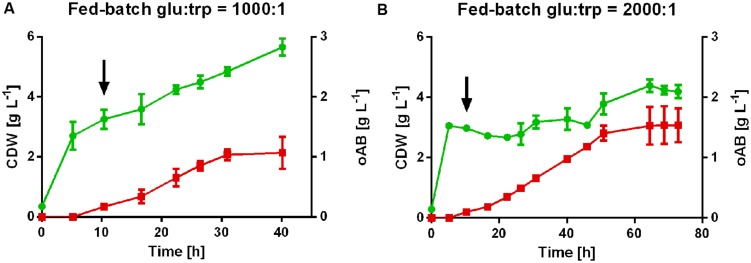
FIGURE 4.
Tryptophan-limited fed-batch cultures of P. putida KT2440 ΔtrpDC pSEVA234_aroGD146N_trpES40FG in controlled bioreactors with different feeding approaches. (A) Feed molar ratio of glucose to tryptophan 1,000:1. (B) Feed molar ratio of glucose-to-tryptophan 2,000:1.  , cell dry weight;
  , oAB concentration. The arrows indicate the start of the feed after the initial batch phase.

