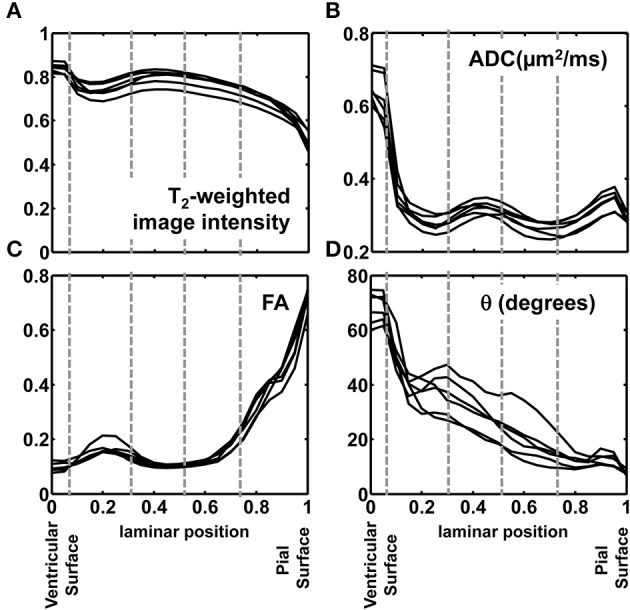
Figure 7.

Post mortem MRI parameters projected onto radial position. T2-weighted image intensity, normalized to a common mean value (A), ADC (B), FA (C), and θ (D) are plotted for each of the six hemispheres against relative position along the set of streamlines extending from the ventricular to the pial surface. The locations of borders between MRI-identified tissue zones are indicated as dashed vertical lines.
