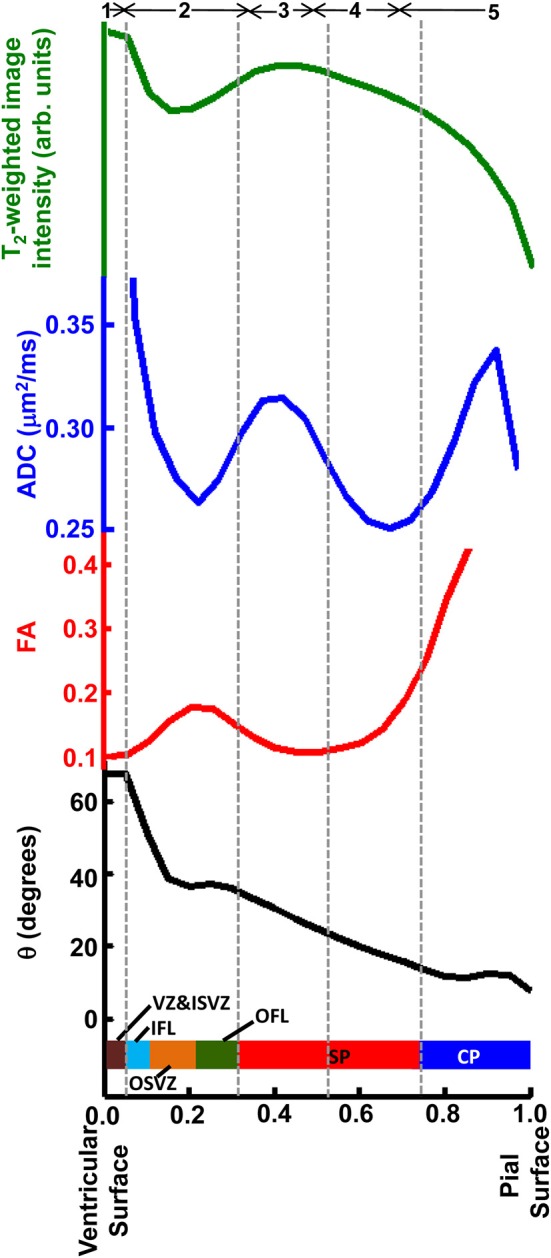
Figure 9.

Averaged T2-weighted image intensity (green), ADC (blue), FA (red), and θ (black) from all six hemispheres were plotted against relative laminar position. Six tissue layers reported in Smart et al. (2002) were displayed relative to the abscissa and five tissue zones identified on post-mortem ADC maps, indicated by gray dashed lines.
