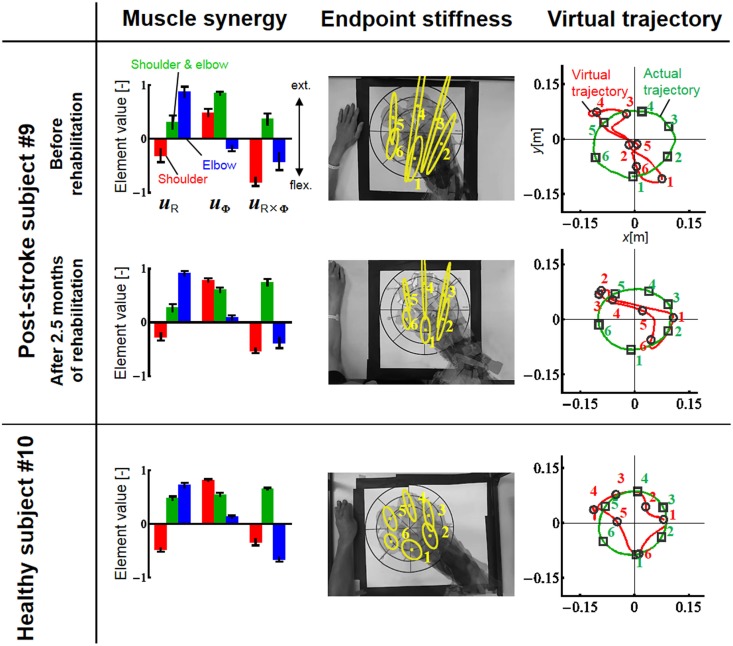
Figure 9.
Change in muscle synergies, endpoint stiffness, and virtual trajectories before and after 2.5 months of rehabilitation. The top, middle, and bottom blocks are for the post-stroke subject before rehabilitation, after 2.5 months of rehabilitation, and for the healthy subject from the same generation, respectively. The three-bar sets represent the muscle synergies in the radial direction (uR), tangential direction (uφ), and null direction (uR×φ). Each number on the stiffness ellipses indicates the progress of movement with time and corresponds to each number of points on the actual and virtual trajectories.

