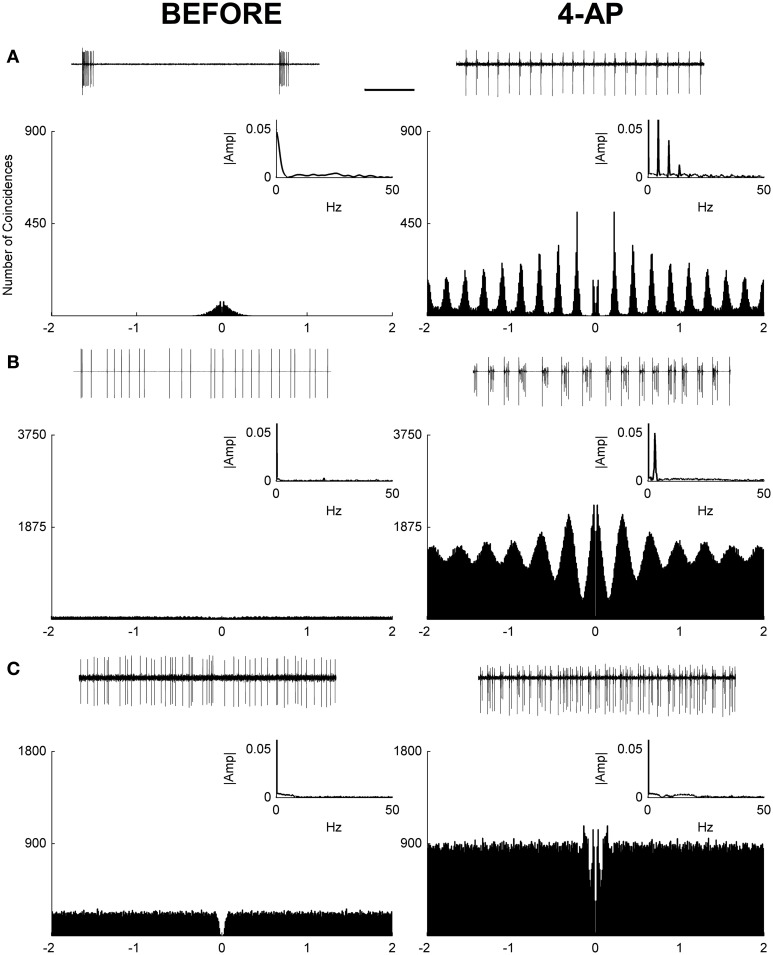
Figure 1.
Autocorrelograms and power spectra of RGC spontaneous activity recorded from rat isolated retinas. (A–C) Spike extracellular recordings (top traces), autocorrelograms (main plot), and power spectra (small insets) in three exemplar cells before (left) and during (right) the application of 4-AP (0.02 mM). In some cases (12 out of 20 RGCs) a periodic behavior was observed in the presence of 4-AP with frequencies in the range of 2.2–5 Hz (mean ± STD = 3.52 ± 0.86). Three different behaviors could be detected in the 4-AP conditions, periodic non-bursting (A), periodic bursting (B), non-periodic (C). The periodic non-bursting behavior was characterized by groups of one or two spikes repeated at regular intervals with sharp peaks in the autocorrelogram and harmonic components in the power spectrum. For periodic bursting, highly regular bursting activity, with dilated peaks in the autocorrelogram and no armonic components in the power spectrum was observed. The non-periodic behavior consisted of a flat autocorrelogram and no clear dominant frequencies in the power spectrum. The black scale bar (1 s, top of panel A) applies to all spike recording traces (A–C).

