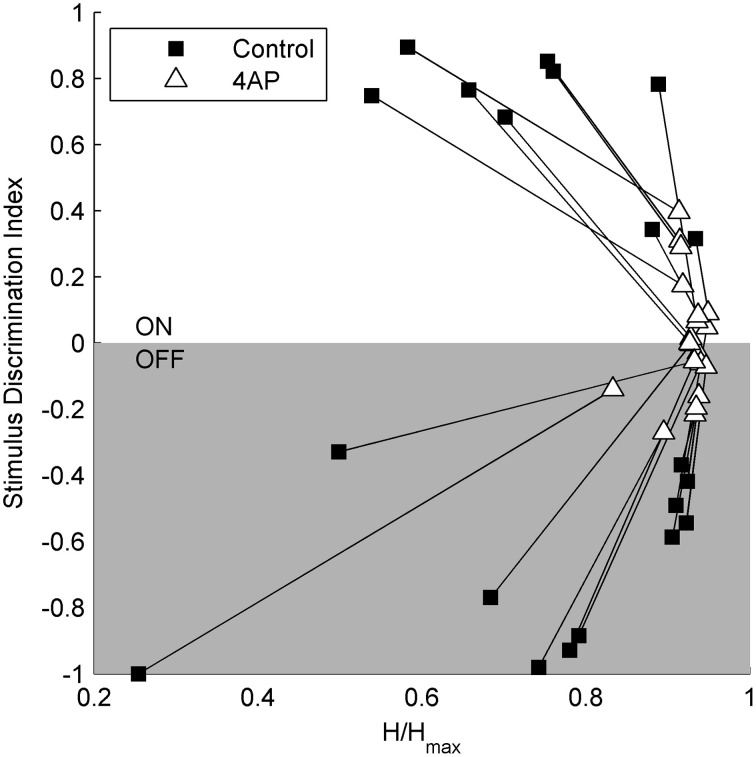
Figure 3.
Relation between stimulus selectivity and spike rate variability suggests a reduction of the visual transfer of information in the presence of 4-AP. Stimulus selectivity (y-axis) is expressed as a Discrimination Index = (A1 – A2)/(A1 + A2), where A1 is the number of spikes during the light pulse and A2 is the number of spikes right after the stimulus calculated on a time window of the same duration as the light pulse. It is positive for ON cells and negative for OFF cells. In both ON and OFF the Discrimination Index converges to 0 following the application of 4-AP suggesting a firing activity which becomes less dependent on light stimuli. The entropy of ISIs (x-axis) was calculated as H = on a perisimuls time window of 4 s. The Standardized Entropy (Hs) was then obtained dividing H by the maximum entropy value of each ISI series [calculated as log(n) where n is the number of ISIs] to account for differences in the number of spikes among the series. In accordance to the previous index, the entropy is much closer to its maximum value after the application of 4-AP. All calculations where performed on single traces obtained for each cell by the superimposition of 30 sweeps, in both control and 4-AP conditions. Pairs of black squares and white triangles connected by lines indicate single RGCs before (black squares) and in the presence of 4-AP (white triangles).

