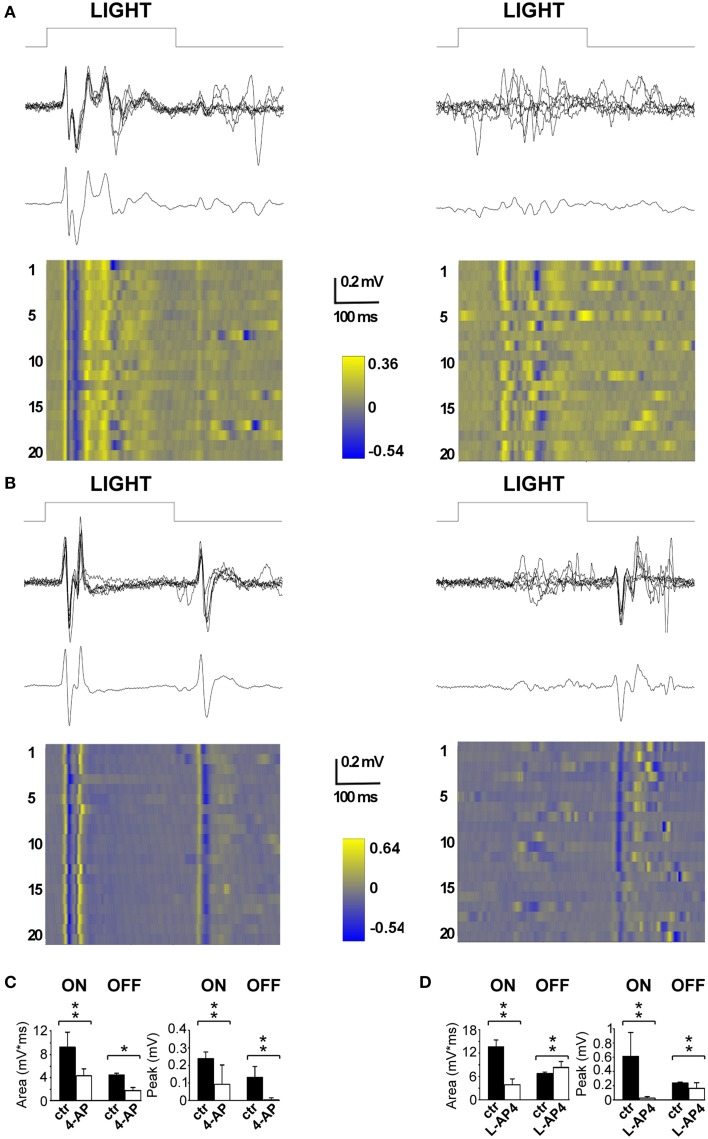
Figure 4.
Effects of 4-AP and L-AP4 on visual evoked potentials (VEPs) recorded from the V1 area. (A,B) Representative VEPs recorded before (left) and after (right) the application of 4-AP (2 mM) (A) and L-AP4 (2 mM) (B). Rats were stimulated with light pulses lasting 300 ms (111 μW/cm2) before (traces on the left) and after (traces on the right) the intravitreal injection of either 4-AP (A) or L-AP4 (B). In both panels, above it is plotted the superimposition of n = 6 individuals sweeps, below the corresponding ensemble average. Notice how in control conditions (traces on the left) after the change in luminance there is a clear change in voltage (ON cortical response) and that the interruption of the stimulation also produces an effect which is smaller and less reproducible in shape across different experiments (OFF cortical response). (C,D) Quantitative analysis for the ON and OFF responses before (black bars) and after (white bars) intravitreal injections of 4-AP (C) and L-AP4 (D). Bars plot the integral of root mean square or quadratic mean (RMS) (right bars in C,D) or the peak amplitude of the first positive response (left bars in C,D). The RMS of the ON and OFF responses were integrated for 150 ms from the start (ON) or from the end (OFF) of light pulses. All pair comparisons yielded significant differences (n = 3 rats for each condition; 60 sweeps before and after drug treatment; stars indicate significance: *indicates p-values < 0.05, **indicates p-values < 0.01; permutation tests based on t-type statistics).

