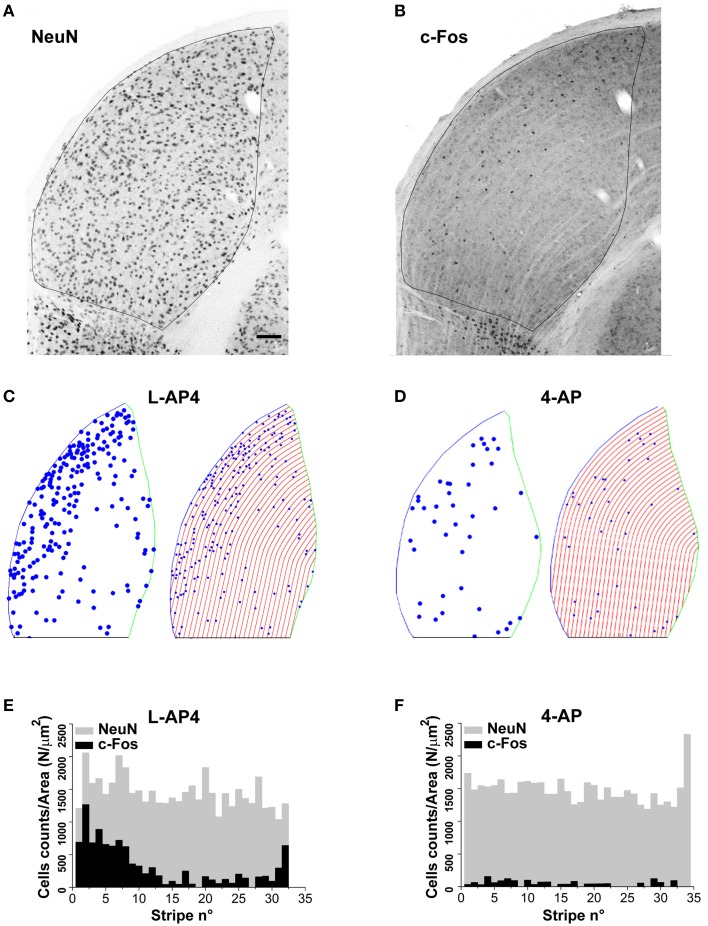
Figure 9.
Lateralization of active NeuN positive neurons in the dLGN structure. (A,B) Double immunostaining for the neuronal marker NeuN (A) and the c-Fos protein (B) in the dorsal portion of the right lateral geniculate nucleus. These two panels refer to an animal whose left eye was injected with 4-AP (2 mM) and then light stimulated. (C,D) Digital reconstructions to illustrate the location of double positive NeuN-c-Fos neurons and the procedure used to subdivide the dLGN structure in parallel stripes of constant thickness (see Materials and Methods Section for the procedure used to subdivide the LGN in stripes). The panels illustrate two exemplar experiments where the left eye was injected with either L-AP4 (2 mM; C) or 4-AP (2 mM; D) and then light stimulated. (E,F) Histograms plot the number of NeuN positive cells (gray bars) and double positive NeuN-c-Fos neurons (black bars) in each stripe. The histograms plot raw cell counts for sequential stripes from a single section normalized by the corresponding stripe area to compensate for the reduction of stripe area due to the LGN curvature. Histograms of normalized counts always displayed a fairly uniform distribution of NeuN cells along the latero-medial axis (p > 0.4) while double positive NeuN-c-Fos neurons always displayed a skewed distribution with higher density for stripes near the lateral edge of the dLGN. To test if the median value of double positive NeuN-c-Fos neurons was significantly smaller (closer to the lateral edge) than the median value of the NeuN cell population, for each dLGN section 10.000 random samples were extracted from the NeuN set (sample size equal to the observed NeuN-c-Fos sample size). Then, for each sample (n = 2 randomly selected sections from each animal; n = 3 animals for each experimental condition) the position of each cell along the lateral-medial axis was calculated as before and the median value for each sample calculated. The p-value was calculated as described in theMaterials and Methods Section with Monte Carlo methods. P-values where then adjusted for multiplicity by means of the Bonferroni-Holm procedure. Results indicate that in every case the null hypothesis (double positive neurons median value not smaller than NeuN set median value) could be rejected (p always < 0.05 using Bonferroni-Holm correction).

