
Figure 2.
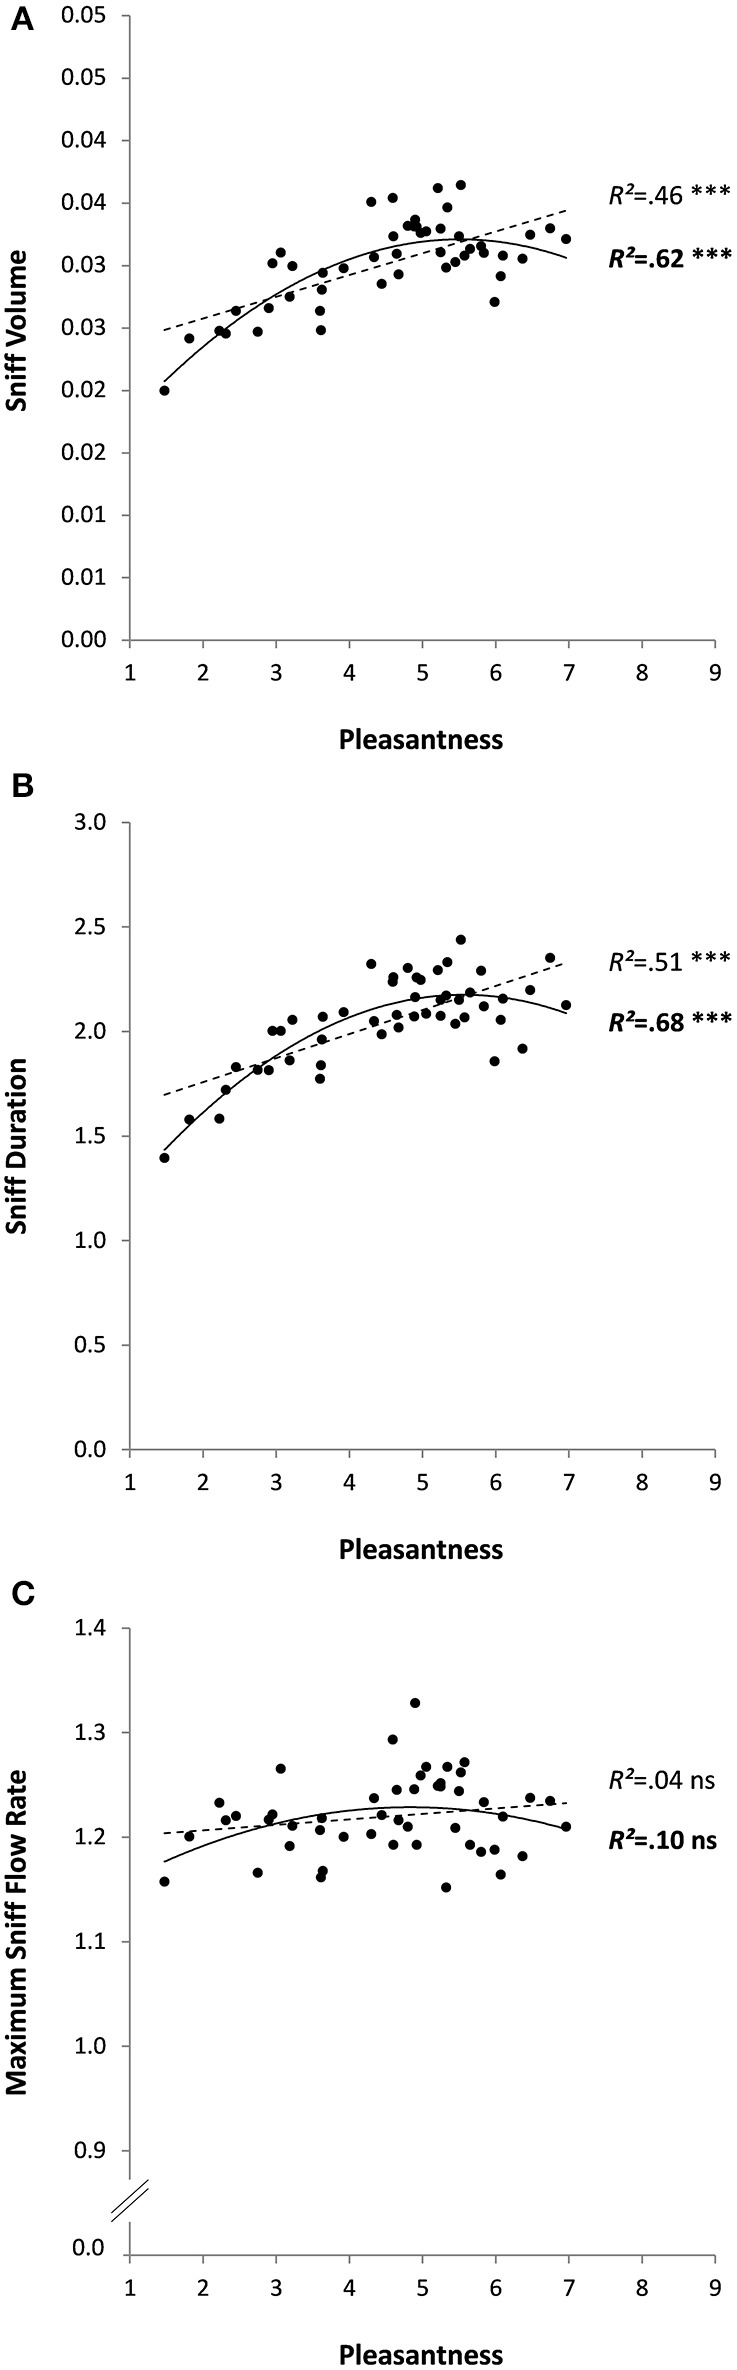
Sniff characteristics (A: volume, B: duration, and C: maximum flow rate) as a function of odor pleasantness for 48 odorants in Experiment 1. Linear and quadratic relationships are represented by trend curves, R2 and level of significance (***p < 0.001; ns: non-significant or p > 0.05; linear: dashed line and regular font; quadratic: continuous line and bold font).