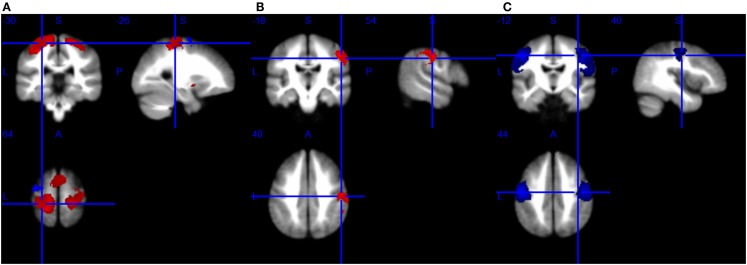
Figure 2.
Brain response abnormalities in motor neuron disease (MND) compared with healthy controls (HCs). Areas with increased activity relative to controls are displayed in red, and areas with decreased activity are displayed in blue. In the meta-analyses, compared with HCs, patients with MND had significant hyperactivity in the left postcentral gyrus and right precentral gyrus, and hypoactivity in the left precentral gyrus during right-hand movement execution (A); hyperactivity in the right postcentral gyrus during right-hand movement imagery or observation (B); and hypoactivity in the bilateral precentral gyrus at rest (C).

