
Figure 8.
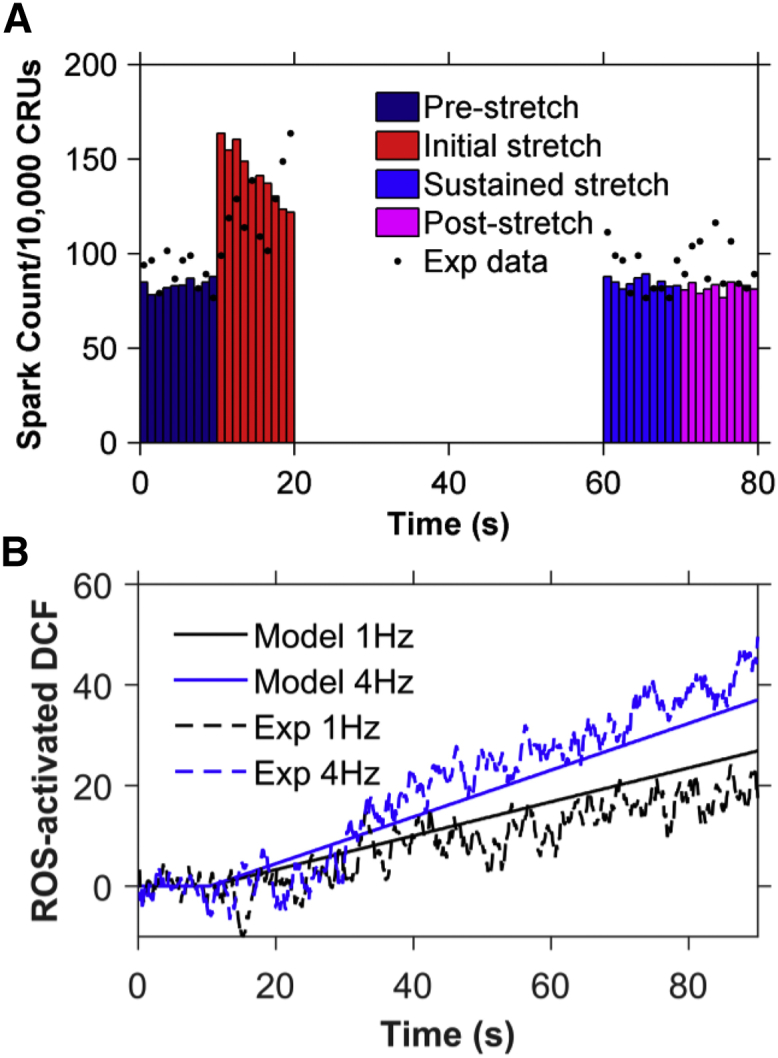
Comparison of simulation results modeled for 8% stretch (11) to experimental results for 10% stretch (12). Experimental data were normalized to the model data to compensate for the difference in the amount of stretch. (A) Ca2+ spark histograms for 1 s bins when the model is simulated for 80 s and the myocyte is stretched from 10 to 70 s (n = 11 simulations). The spark frequency returns to its prestretch value during the last 10 s of stretching, as seen in the experimental data, represented by black dots. (B) Comparison of simulated values (solid lines) to experimental values (dashed lines) of the total concentration of activated DCF at 1 Hz (black) and 4 Hz (blue) of cyclic stretching from 10 to 90 s. To see this figure in color, go online.