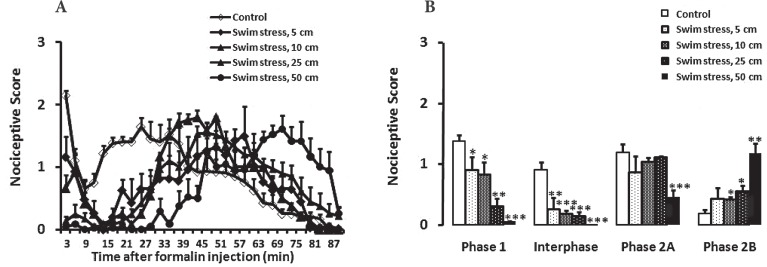
Figure 1.
Time scores of formalin induced nociceptive behaviours (mean ± S.E.M. of 8 rats per group) following swim stress in different high of water measured every 3 minutes for 90 minutes (A) and bar chart for formalin test after swim stress in male rats (B). The columns represent the mean of nociceptive score in each phase: phase 1 (minutes 1–7), interphase (minutes 8–14) and first part (minutes 15–60) and second part (minutes 61–90) of phase 2 (B). For compression between swim stress in different high and control in male rats, all groups in the different high of water and control plotted in one graph. * P<0.05; ** P<0.01 and *** P<0.001 in comparison with male group.

