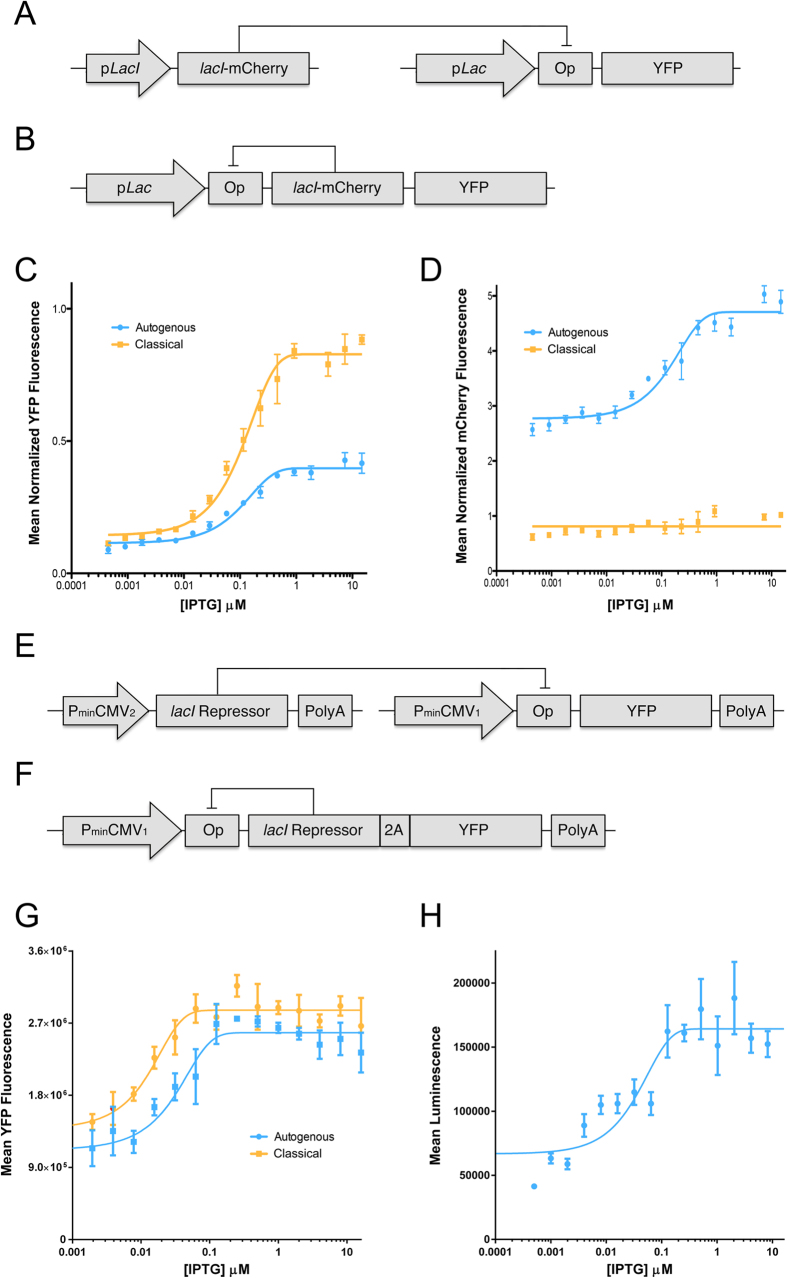
Figure 1. Comparison of constitutively and autogenously regulated transgene systems in E. coli and HEK293T cells.
(A, B) Schematic diagram of the bacterial (A) classically regulated expression system (CRES) and (B) autogenously regulated expression system (ARES) tested in panels (C, D). Promoters, regulator genes, reporter genes, and operator sequence are indicated. (C) Mean normalized YFP fluorescence as a function of IPTG concentration for both the CRES and ARES in E. coli. Data were normalized to an E. coli tranformant expressing YFP under the control of a constitutive promoter. Data points represent mean +/− SEM, n = 5. (D) Mean normalized mCherry fluorescence of the lacI-mCherry fusion as a function of IPTG concentration for both CRES and ARES in E. coli. Data were normalized to an E. coli tranformant expressing lacI-mCherry under the control of a constitutive promoter. Data points represent mean +/− SEM, n = 5. (E, F) Schematic diagram of the eukaryotic (A) classically regulated expression system (CRES) and (B) autogenously regulated expression system (ARES) tested in panel (G). Promoters, regulator genes, reporter genes, polyadenylation sites, 2A cleavage signal, and operator sequence are indicated. (G) Mean YFP fluorescence as a function of IPTG concentration for both the CRES and ARES in transfected 293T cells. Data points represent mean +/− SEM, n = 3. (H) Mean luminescence as a function of IPTG concentration for the ARES encoding luciferase as a reporter in AAV-transduced 293T cells. Data points represent mean +/− SEM, n = 3.

