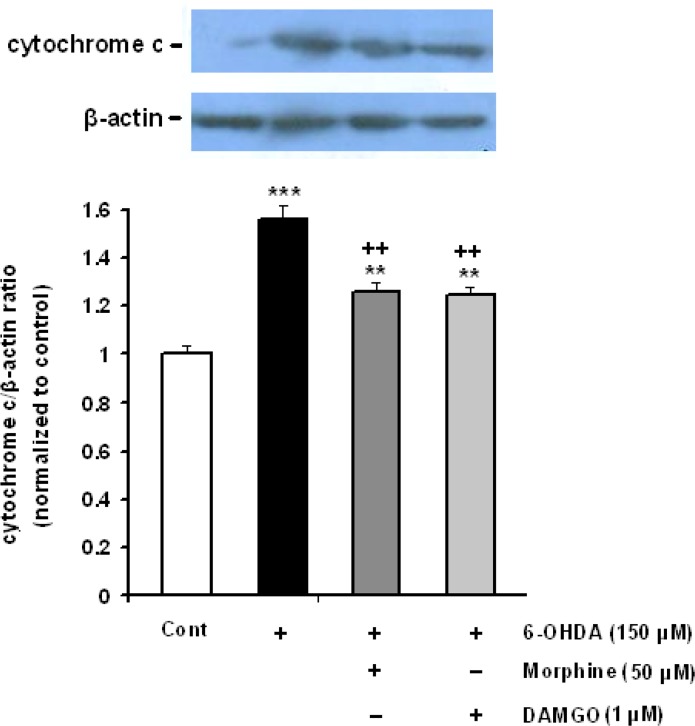
Figure 6.
Effect of morphine and DAMGO on the 6-OHDA-induced cytochrome-c release in SH-SY5Y cells. Each value represents the mean±SEM band density ratio for each group. β-actin was used as an internal control. **P<0.01 and ***P<0.001 significantly different versus control group. ++P<0.001 versus 6-OHDA-treated cells.

