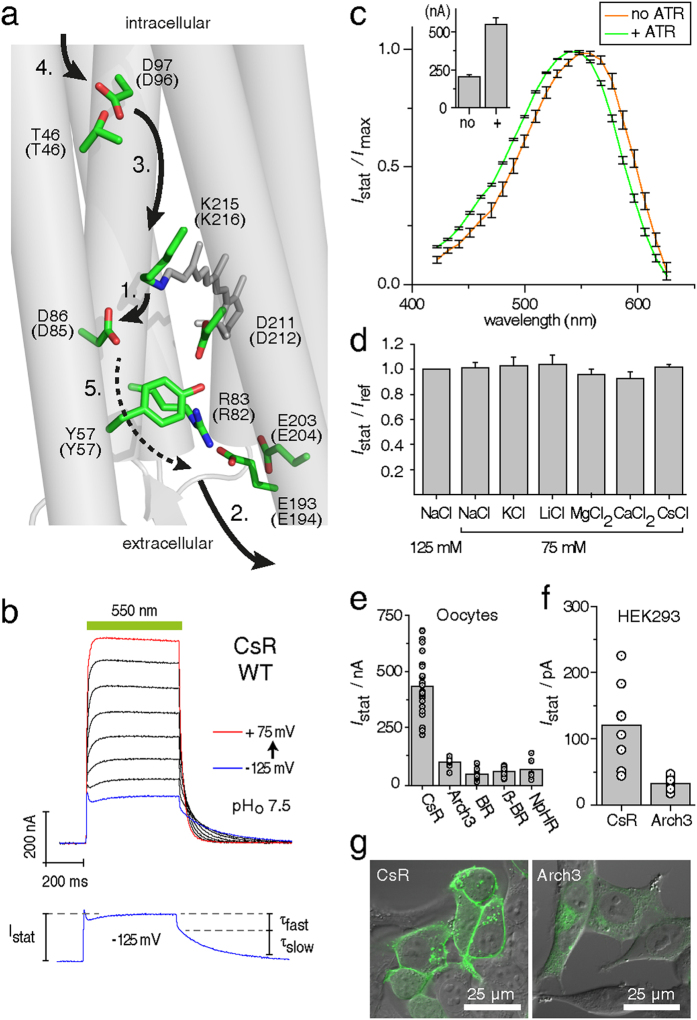
Figure 1. Basic characterization of CsR in Xenopus laevis oocytes and HEK-293 cells.
(a) Proposed structure of CsR-WT with mutated residues based on the BR crystal structure (PDB: 1M0L). Brackets indicate respective positions in BR and demonstrate the high conservation of key residues. Arrows highlight the proposed proton transport pathway of CsR-WT, which is similar to BR. A dotted arrow is used to indicate that whether R83 deprotonates itself during the photocycle remains to be determined. (b) Typical photocurrents of CsR-WT measured in oocytes at extracellular pHo 7.5 after illumination with 550 ± 25 nm. Holding potentials were increased from −125 mV in 25 mV steps up to +75 mV. Separated current trace illustrates the biexponential decay after light illumination. (c) Action spectra measured in oocytes at pH 7.2 with supplementation of 5 μM all-trans retinal (ATR, n = 7) and without ATR (n = 5). Currents were normalized to the maximal stationary currents. Inset shows absolute amplitudes at 0 mV (ATR, n = 16; without ATR, n = 21). (d) Ion selectivity measured in oocytes at pHo 7.2 and 0 mV (all n = 5 except CsCl, n = 3). (e) Absolute photocurrent amplitudes of diverse microbial pumps at pHo 7.5 as measured in oocytes (all at 0 mV, illumination with 550 ± 25 nm, CsR [n = 24], Arch3 [n = 8], BR [n = 19], βHK-BR [n = 17], NpHR [n = 6]). (f) Absolute photocurrent amplitudes of CsR-WT-EGFP (n = 8) and Arch3-WT-EGFP (n = 11) measured in HEK-293 cells (0 mV, 550 ± 7 nm, pHo 7.2, pHi 7.2 after 24–30 h, 1 μM ATR). (g) Confocal images of HEK-293 cells transfected with CsR-WT-EGFP or Arch3-WT-EGFP (after 24–30 h, 1 μM ATR). Scale bars represent 25 μm. Data represent the mean ± SE.

