
Figure 8. Risk-score and ROC curves for the ability of the maternal serum expression of six miRNAs in miR-17-92 cluster to differentiate the macrosomia from the controls.
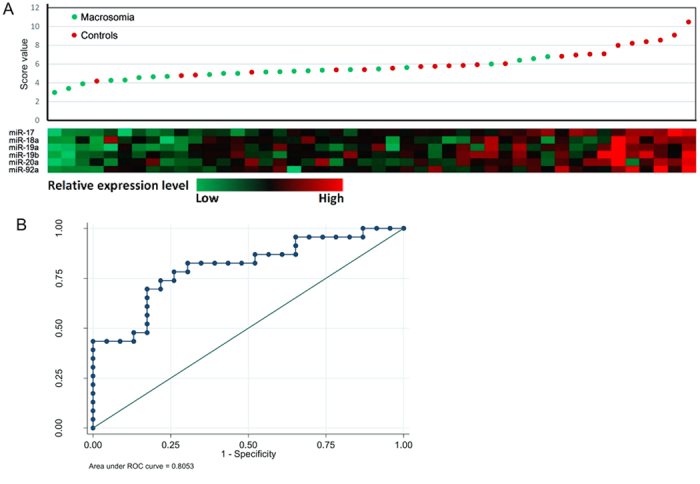
(A) Risk-score distribution and color-gram of serum-miRNA expression profiles of macrosomia were performed. Rows represent miRNAs and columns represent subjects. Green denotes down-regulated expression and red denotes up-regulated expression compared with the mean. (B) ROC curve was shown for the ability of the six miRNAs to differentiate macrosomia from the controls.