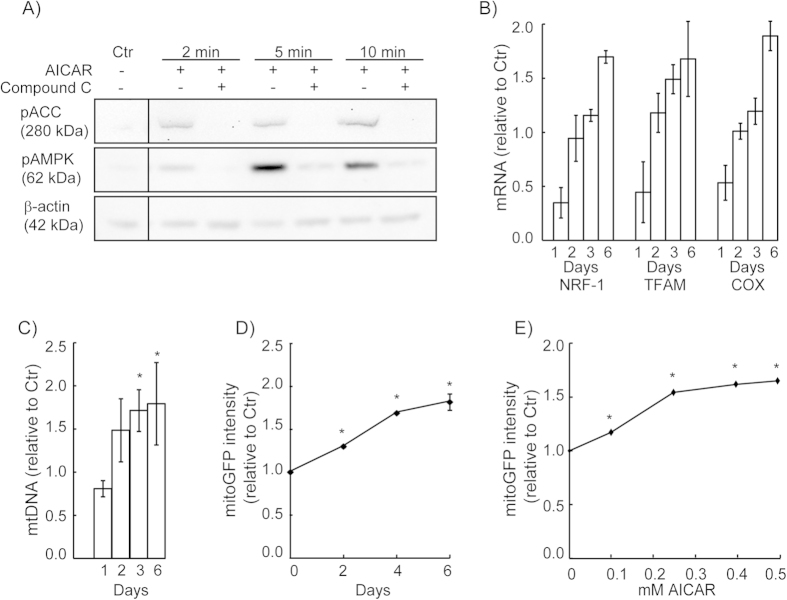
Figure 2. Biochemical markers of mitochondrial biogenesis in the reporter cells.
(A) AMPK activation in HeLaNRF1/c4 cells. The cells were treated with 0.5 mM AICAR for 2, 5 or 10 min, with or without the AMPK inhibitor Compound C (10 μM). The levels of phosphorylated AMPK (pAMPK) and ACC (pACC) were analysed by western blotting. (B) The effect of AICAR (0.5 mM) on expression of NRF-1, TFAM and COX was measured at four different time points (1, 2, 3 and 6 days), by quantitative PCR. The data were calculated relative to the untreated control (Ctr) and are shown as mean ± S.D. of two experiments with triplicate measurements. (C) The amount of mtDNA relative to nuclear DNA (mtDNA copy number) was measured by quantitative PCR, in cells grown for 1, 2, 3 or 6 days in presence of AICAR (0.5 mM). The data were calculated relative to untreated control (Ctr), and are shown as mean ± S.D. of three experiments with triplicate measurements. (D) Kinetics of mitoGFP induction. The expression of mitoGFP was measured by flow cytometry at different time points during 6 days of treatment with AICAR (0.5 mM). The data represents mean ± S.D. of three experiments (10 000 cells per sample), calculated relative to untreated cells. (E) Dose-response of AICAR in HeLaNRF1/c4 cells. The cells were treated with increasing concentrations of AICAR for 6 days and mitoGFP was detected by flow cytometry (10 000 cells per sample). The data represent mean ± S.D. of n ≥ 3. *p < 0.05; (C) compared with day 1, ANOVA test with Tukey’s multiple comparisons test; (D, E) compared with Ctr, Student’s t-Test.

