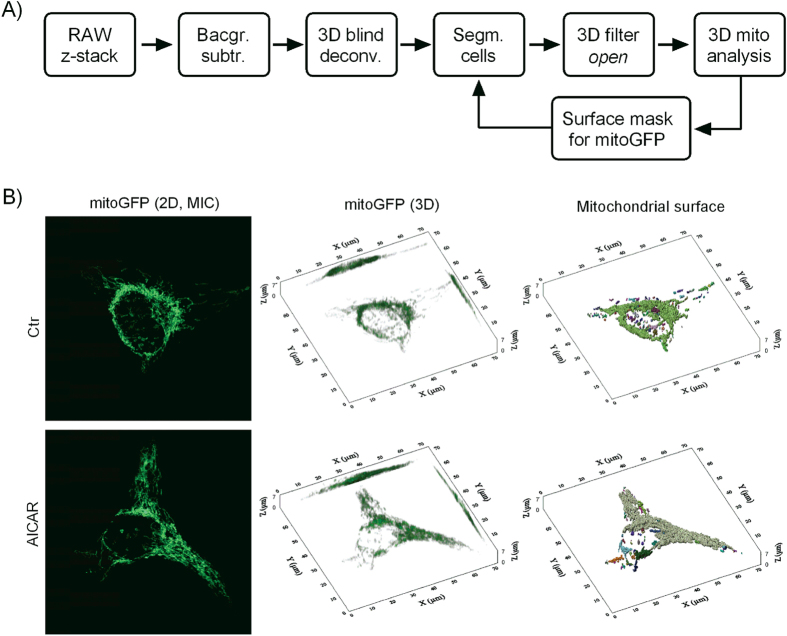
Figure 3. Quantitative 3D image analysis of mitochondrial morphology.
(A) Image processing and analysis was performed essentially as described previously25. The illustration gives an overview over the individual steps of the procedure. Background correction was performed on the unprocessed confocal z-stacks (RAW), by subtracting a fixed intensity decided from non-mitochondrial areas. Following 3D blind deconvolution, individual cells were segmented manually to enable single-cell analysis. The resulting z-stacks were processed by the 3D open filter, and loaded into the 3D module for analysis. The isosurface created in this process was applied as mask for measurement of mitoGFP intensity in the mitochondrial compartment, in the respective z-stacks not processed by the 3D open filter. B) Mitochondria imaged in untreated (Ctr) and AICAR-treated HeLaNRF1/c4 cells. The left-hand images show 2D maximum intensity composites (MICs) of the processed z-stacks from two representative cells. The centre images show the same cells in 3D, based on mitoGFP from all the z-stack section. The right-hand images show the mitochondrial isosurface, which was created to segment and analyse the mitochondria.

