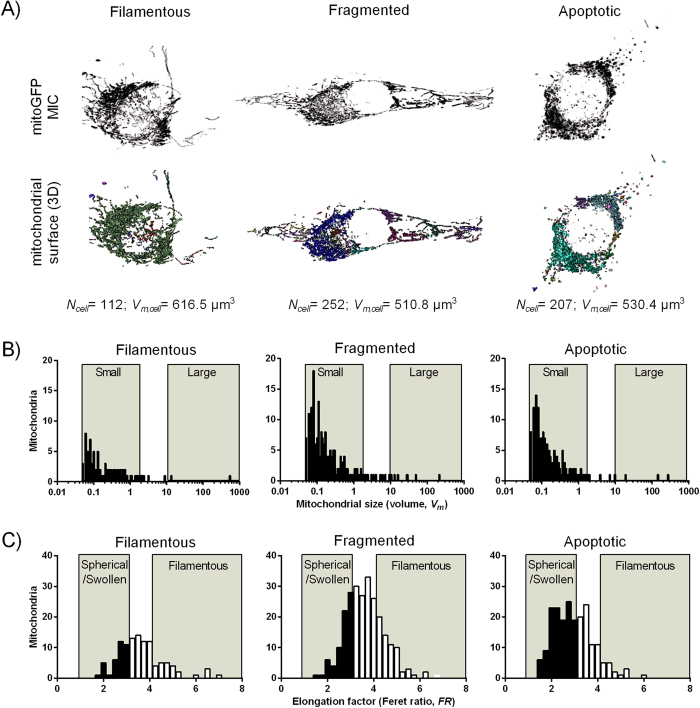
Figure 5. Assessment of mitochondrial morphology.
HeLaNRF1/c4 cells were treated with CCCP (5 μM, 30–60 min) to induce mitochondrial fragmentation. Mitochondrial fragmentation was observed in most cells, and some cells (very few) showed signs of apoptotic mitochondrial morphology. (A) Three cells with similar amount of mitochondrial biomass (Vm,cell), but with distinct mitochondrial morphologies, were selected to characterize the different mitochondrial subpopulations. The three types of morphology are shown as “filamentous”, “fragmented”, and “apoptotic”. The upper images show contrast enhanced projections (mitoGFP, MIC) of the z-stacks, with the surface of the respective 3D-segmented mitochondrial objects underneath. (B) Frequency distribution analysis based on Vm. The following mitochondrial subpopulations were defined: “small”, Vm = 0.05–2 μm3; “medium size” Vm = 2–10 μm3; “large”, Vm > 10 μm3. The gates of the “small” and “large” subpopulations are shown in the diagram. (C) Frequency distribution analysis based on Feret ratio (FR). The following mitochondrial subpopulations were defined: “spherical/swollen”, FR = 1–3; “elongated”, FR = 3–4; “filamentous”, FR > 4). The gates of the “spherical/swollen” and “filamentous” subpopulations are shown in the diagram.

