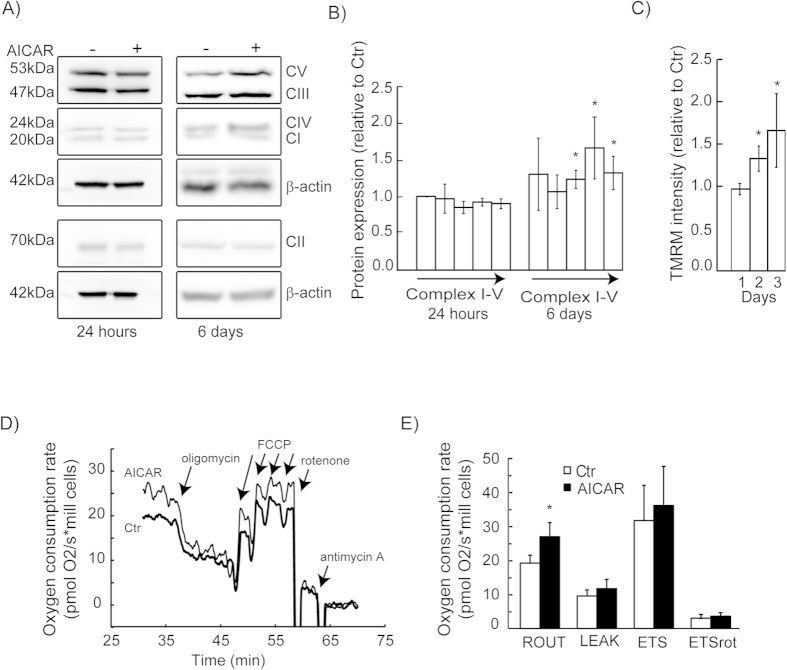
Figure 7. Mitochondrial respiration.
(A) Western blot analysis of OXPHOS proteins of complex I–V (CI-V), in HeLaNRF1/c4 cells treated with 0.5 mM AICAR for 24 hours or 6 days. The shown blots are representative for three independent experiments. (B) Data quantified from the immunoblots (in A). Protein expression levels (normalised to β-actin) were calculated relative to untreated control (Ctr) and are shown as mean ± S.D. of three experiments. (C) Mitochondrial membrane potential was studied using the fluorescent probe TMRM, after 1, 2 and 3 days of treatment with AICAR (0.5 mM). The data represents mean ± S.D. of three experiments (10 000 cells per sample). (D, E) Oxygen consumption rates in HeLaNRF1/c4 cells after treatment with AICAR (0.5 mM, 6 days). (D) The diagram shows a representative experiment. (E) Data analysis of routine (basal) respiration rate (ROUT), uncoupled respiration (LEAK), respiratory capacity (ETS), and rotenone insensitive respiration (ETSrot). Data are presented as mean ± S.D. of five experiments. *p < 0.05 comparing AICAR-treated cells with Ctr.

