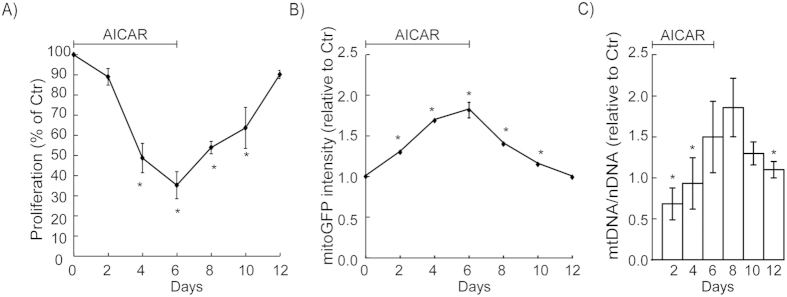
Figure 8. Mitochondrial reversion after withdrawal of AICAR.
HeLaNRF1/c4 cells were cultured in presence of AICAR (0.5 mM) for 6 days, followed by a subsequent period (6 days) in absence of AICAR. Samples were collected and analysed every second day during the experimental period. (A) Proliferation was examined by cell counting. The data, calculated as percent of the untreated control cultures (Ctr), are shown as mean ± S.D. of three independent experiments. (B) The intensity of mitoGFP was detected by flow cytometry (10 000 cells/sample). The diagrams show the mitoGFP level relative to control as mean ± S.D. of three independent experiments. (C) mtDNA (copy number) determined by quantitative PCR. Data are presented as mean ± S.D. of six independent experiments with triplicate measurements. *p < 0.05; (A, B) compared with Ctr, Student’s t-Test; (C) compared with 8 days, ANOVA test with Tukey’s multiple comparisons test.

