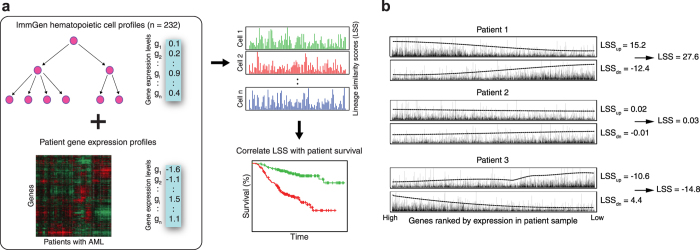
Figure 1. Overview of workflow.
(a) Murine hematopoietic cell expression profiles were downloaded from the Immunological Genome Project and compared against patient gene expression profiles from an AML dataset of interest using the BASE algorithm. This resulted in a lineage similarity score (LSS) that reflects gene expression concordance between a given hematopoietic cell type and a given patient. The resulting patient LSSs were then used as covariates in a Cox proportional hazards model. Cell types that were significantly associated with patient survival were explored in more detail. (b) For each murine hematopoietic cell profile, genes are ranked from high to low based on their expression values. These weights are then assigned to a list of genes ranked by patient gene expression profiles. LSSup is determined based on concordance between hematopoietic up-regulated weights and patient rank, with a more positive value representing higher concordance. LSSdn is determined based on concordance with the down-regulated weights and patient rank, with a more negative value representing higher concordance. Dotted lines represent 10*mean(weight) over a rolling window of 1000 genes. The LSSdn is then subtracted from the LSSup to obtain the final LSS, which represents the similarity between patient and hematopoietic cell gene expression profiles. Patients 1, 2, and 3 are examples of a high, intermediate, and low LSS, respectively.

