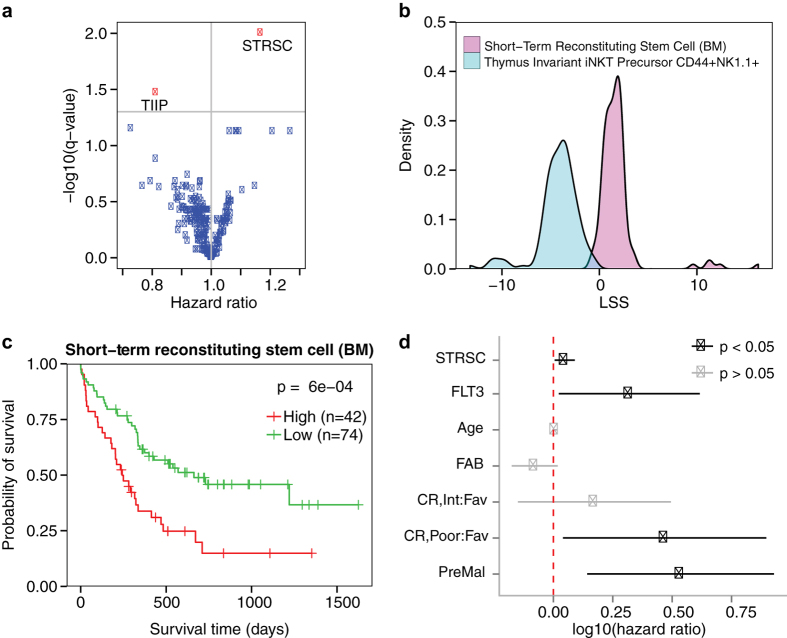
Figure 3. Survival analysis of the short-term reconstituting stem cell LSS.
(a) Distribution of the hazard ratios and adjusted p-values derived from univariate Cox proportional-hazards models that included murine hematopoietic cell type LSSs as the variables. Each point corresponds to a different cell type, with red points corresponding to cell types with an adjusted p-value < 0.05 and blue points corresponding to cell types with an adjusted p-value > 0.05. The two red dots correspond to the short-term reconstituting stem cell (STRSC) and thymus invariant iNKT precursor CD44+NK1.1+ (TIIP). (b) Density plot of the LSSs for the two cell types significantly associated with survival in the Bullinger dataset. The STRSC is represented by a cyan curve and the TIIP is represented by a magenta curve. (c) Kaplan-Meier plot depicting the survival probability over time for samples with a high (red curve) and low (green curve) STRSC LSS. Vertical hash marks indicate points of censored data. (d) In a multivariate Cox proportional-hazards model, the STRSC LSS is significantly predictive of patient survival even after adjusting for traditional clinical factors. Bars represent log(hazard ratio) 95% confidence interval. Red dotted line indicates where the log10(hazard ratio) = 0.

