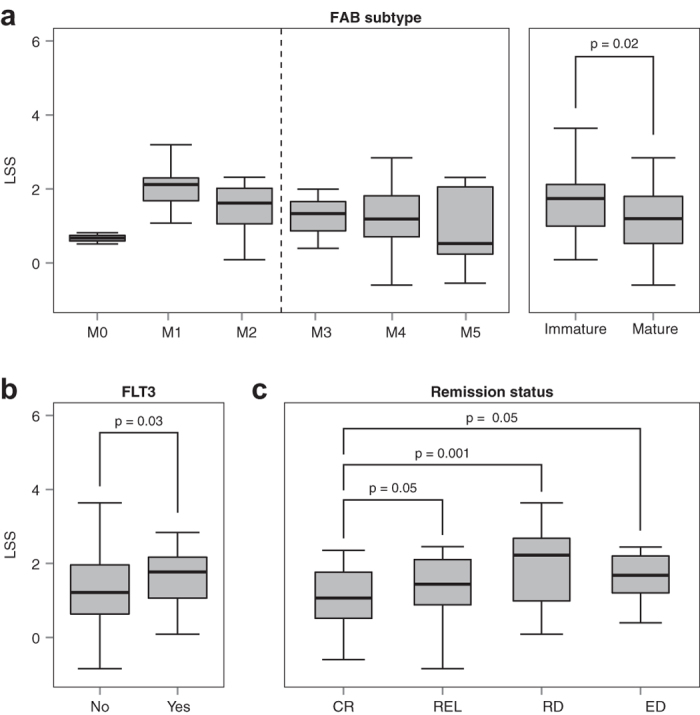
Figure 5. Association of STRSC LSS with traditional clinical variables.

(a) STRSC LSS distributions across the different FAB subtypes (M0-M5) available in the Bullinger dataset. There was an n > 12 for each subtype, except for M0, where n = 3. When FAB subtype was dichotomized into immature (M0-M2) and mature (M3-M5) subgroups, there was a significant difference in the LSS between the two groups (P = 0.02, Wilcoxon rank-sum test). (b) LSS distributions across samples without and with a FLT3 mutation. LSSs were significantly higher in the yes group than the no group (P = 0.03, Wilcoxon rank-sum test). (c) LSS distributions for patients that had different chemotherapy outcomes. Patients with complete response (CR) had significantly lower LSSs than patients with relapse (REL), refractory disease (RD) and early death (ED) (P = 0.05, 0.001, and 0.05, respectively, Wilcoxon rank-sum test). For all panels, box spans quartiles, with line representing median. Outliers were not removed. Whiskers represent absolute range excluding outliers.
