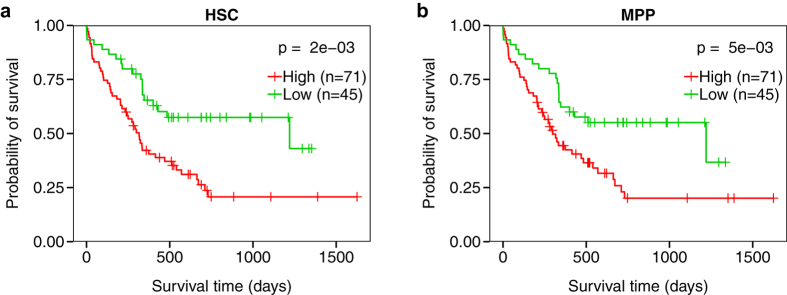
Figure 7. Survival analysis of LSSs for human hematopoietic cell types.
Kaplan-Meier plots depicting the survival probability over time for samples with high (red curves) and low (green curves) LSSs for (a) human hematopoietic stem cell (HSC) and (b) human multipotent progenitors (MPP). Vertical hash marks indicate points of censored data. Both cell types were significantly associated with patient survival (P < 0.05, log-rank test).

