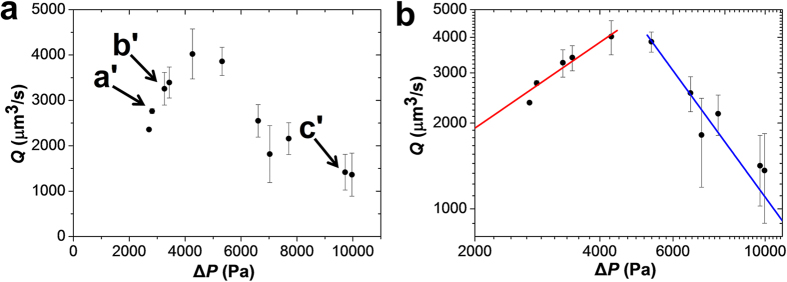
Figure 3. Effect of the pressure difference on the flow rate of water through the confined microgel.
(a) Experimentally measured variation of the volumetric flow rate with pressure difference, plotted for the degree of confinement D0/dc of 3.24 ± 0.03. Arrows indicate microgel positions a′–c′ shown in Figs. 2a′ - 2c′. The portion of the microgel confined to the constriction increases with applied pressure difference. D0 = 104 μm, dc = 38 μm, E0 = 2.57 kPa, α = 30°. (b) The same data presented on a log-log plot and compared with two scaling predictions Q ~ ΔP for weakly-deformed microgel (red line) and Q ~ ΔP–2.0 for constriction-dominated regime (blue line).

