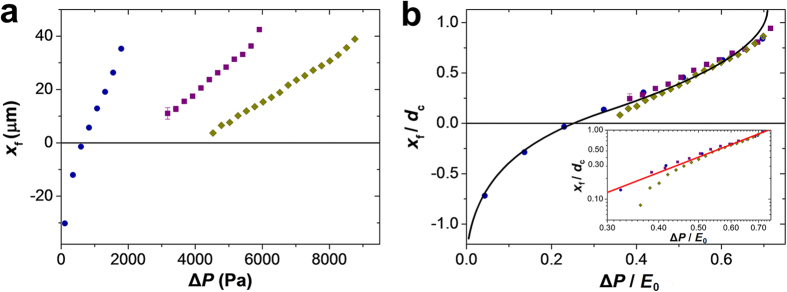
Figure 4. Dependence of the position of the microgel on the applied pressure difference.
(a) Effect of pressure difference on the position of the microgel
front tip xf along the x-axis in the microchannel,
plotted at the same degree of confinement
D0/dc = 2.24 ± 0.01
for the microgels with the Young’s modulus of 2.57 ( ), 8.26 (
 ) and
12.54 kPa (
 ) (corresponding to
agarose concentration in the microgel of 2, 3, and 4 wt%,
respectively). The results are obtained for microgels with corresponding
diameters D0 of 94, 101, and
100 μm, which were passing through the constriction
with a diameter dc of 42, 45 and
45 μm, respectively, at
α = 15°. (b) A master
curve of the relative microgel position
xf/dc, plotted as a function of
ΔP/E0. The colors of symbols in
(b) are the same as in (a). The black curve shows the
result of numerical calculations with a fitting parameter
κ = 0.365 (see
Supplementary Fig. S7e). Inset
shows the data for positive xf on double-logarithmic
scale. Red line with a slope 2.3 demonstrates agreement of data with scaling
equations (2) and (6) for the
constriction regime
(xf > 0).

