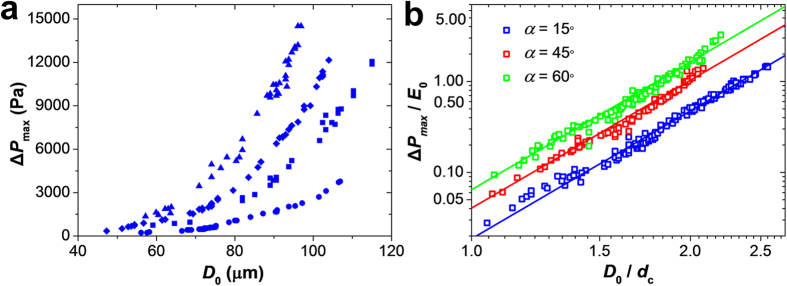
Figure 5. Dependence of ΔPmax on the degree of microgel confinement.
(a) Variation in ΔPmax plotted as a function of microgel diameter D0. dc = 43 ± 2 μm. Microgels with Young’s modulus of 2.57 kPa (circle symbols), 8.26 kPa (square symbols), 12.54 kPa (diamond symbols) and 20.21 kPa (triangle symbols) (corresponding to agarose concentration in the microgel of 2, 3, 4 and 5 wt%, respectively) were tested in the constriction with the entrance angle α = 15°. (b) Log-log plot of the master curves describing the relationship between ΔPmax/E0 and the degree of microgel confinement D0/dc in microchannels with different entrance angles α. Solid lines are the theoretical results obtained from equation (7) with a slope 14/3. Microgels with Young’s moduli (denoted as in (a)) were tested in constrictions with the entrance angles α of 15° (blue color), 45° (red color), and 60° (green color).

