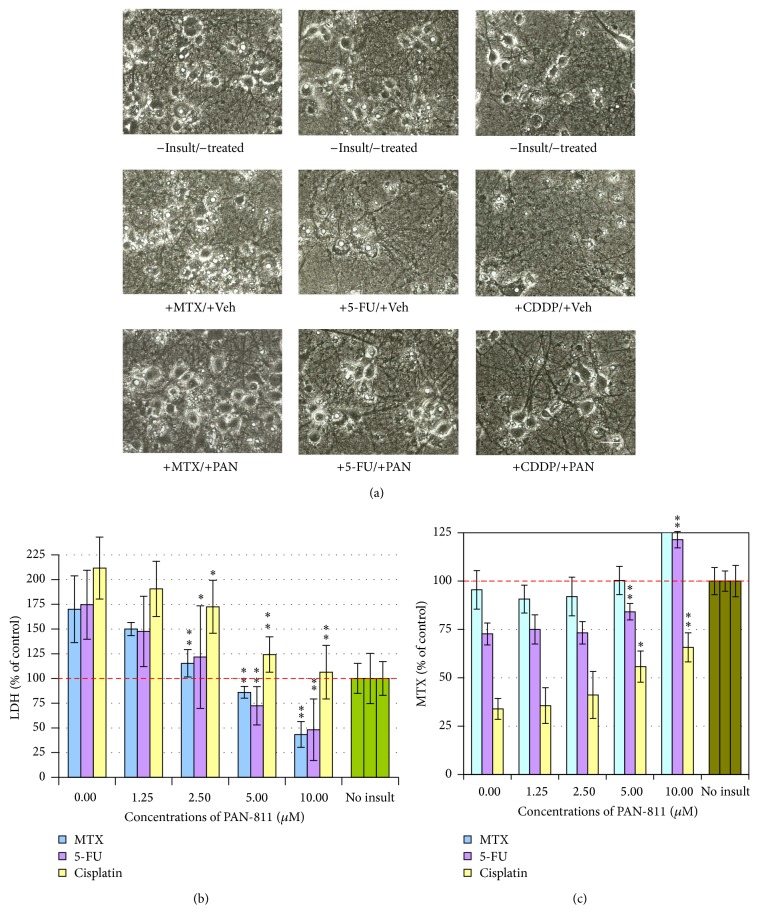
Figure 2.
Dose-dependent neuroprotection of PAN-811·Cl·H2O against anticancer drug-induced neurotoxicity. (a) Phase contrast photographs for neurons in 12.5% AO (bar = 25 μm; PAN: PAN-811·Cl·H2O). (b) LDH analysis for (a) (n = 5). (c) MTS analysis for (a) (n = 6). The bar in green and bars in other colors in the graphs indicate the cultures without an insult and with anticancer drug insults, respectively. Data are expressed as % of noninsulted control. Figure symbols are ∗, P < 0.05, and ∗∗, P < 0.01, compared with insult group alone (without PAN-811 treatment) by one-factor ANOVA followed with Tukey HSD test.

