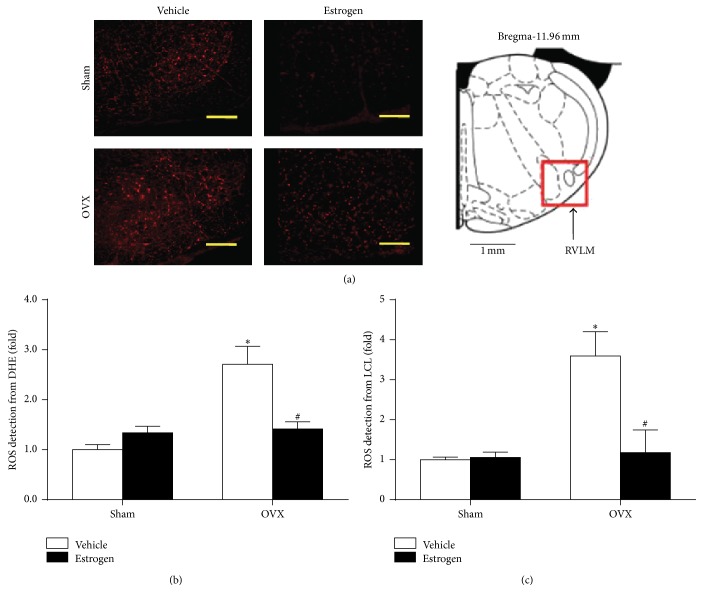
Figure 3.
Estrogen attenuated the level of ROS in the RVLM of sham and OVX rats. (a) Representative confocal images of ROS (red) in the RVLM (indicated by a red square in the rat atlas) stained by fluorescent labeling (DHE). Scale bar, 200 μm. Quantification of ROS production in the RVLM from DHE fluorescent analysis (b) and lucigenin chemiluminescence (LCL) detection (c). Means ± SEM, n = 5/group, ∗ p < 0.05 versus sham vehicle, and # p < 0.05 versus OVX with vehicle.

