Fig. 3.
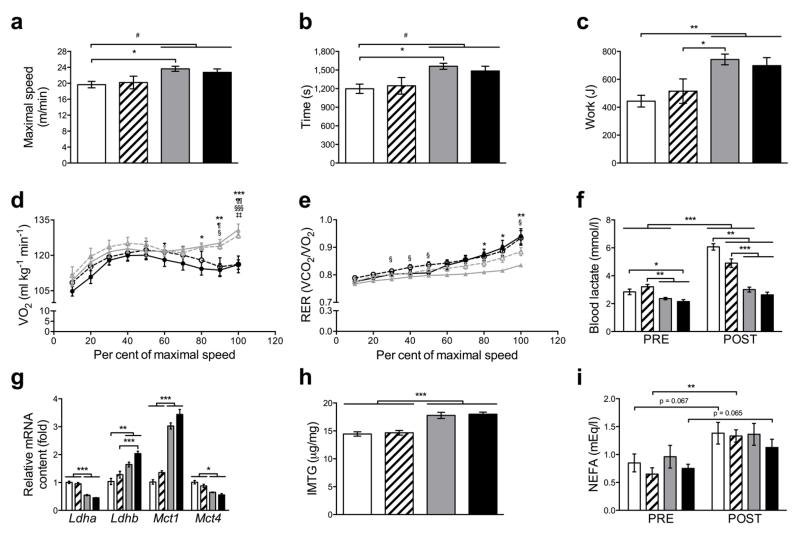
Skeletal muscle PGC-1α modulates whole body metabolism during maximal exercise. (a, b, c) Maximal speed, time and work achieved during exercise tests to exhaustion (n = 10-12 per group). (d and e) Measurement of VO2 and RER during the maximal exercise test (n = 10-12 per group). (f) Blood lactate levels before (PRE) and after (POST) maximal exercise (n = 10-12 per group). (g) mRNA levels of key genes of lactate metabolism in gastrocnemius (n = 6 per group). (h) Quadriceps IMTG content (n = 5 per group). (i) Plasma levels of NEFA before (PRE) and after (POST) exercise (n = 4-6 per group). In a, b, c, f, g, h and I CON: white, PPARβ/δ mKO: white with stripes, PGC-1α mTg: grey, PPARβ/δ mKO + PGC-1α mTg: black. In d and e CON: black continuous line, PPARβ/δ mKO: black discontinuous line, PGC-1α mTg: grey continuous line, PPARβ/δ mKO + PGC-1α mTg: grey discontinuous line. Values are mean ± SEM. *p < 0.05, **p < 0.01, ***p < 0.001. In d and e *p < 0.05, **p < 0.01, ***p < 0.001 CON vs. PGC-1α mTg; ¶p < 0.05, ¶¶p < 0.01 CON vs. PPARβ/δ mKO+ PGC-1α mTg; §p < 0.05, §§§p < 0.001 PPARβ/δ mKO vs. PGC-1α mTg; ‡‡p < 0.01 PPARβ/δ mKO vs. PPARβ/δ mKO+ PGC-1α mTg.

