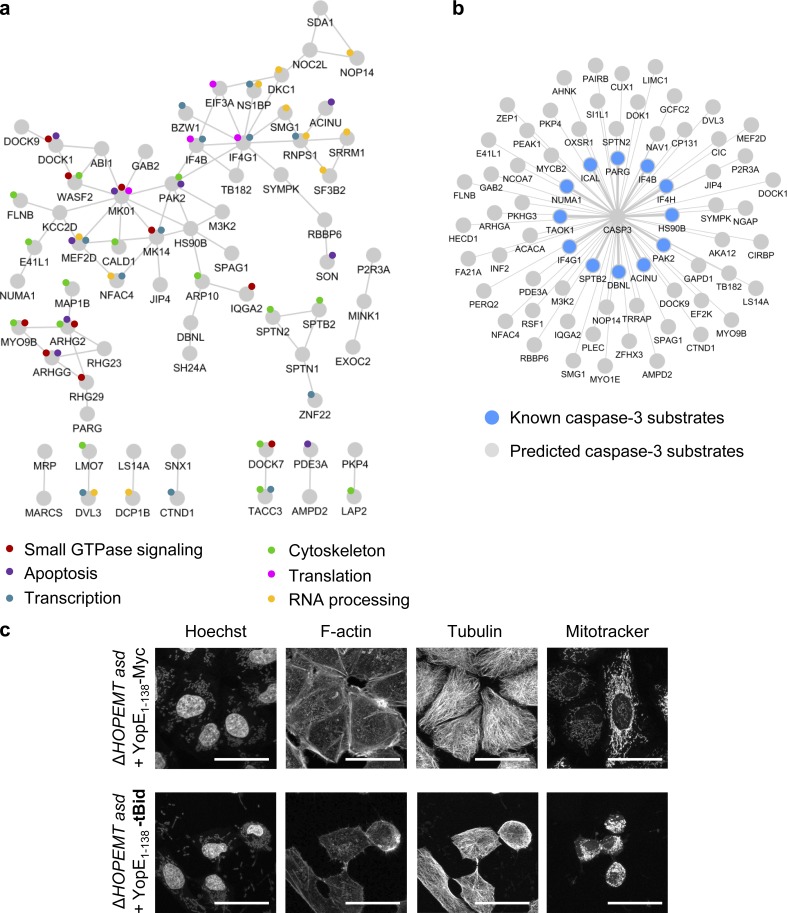
Figure 10.
Analysis of t-BID-dependent phosphoproteome. (a) Representation of the functional protein interaction network of the tBID phosphoproteome. Proteins, containing at least one phosphopeptide undergoing a change in phosphorylation after tBID delivery (light gray; q-value < 0.04) are represented in a STRING network (high-confidence, score 0.7). Only proteins with at least one connection in STRING are shown. Colored circles depict the biological annotation of proteins as obtained from DAVID (Table S5). (b) Graphical representation of CASP3 known (color) and predicted substrates (gray) as shown in Table S1. (c) Confocal images of HeLa cells infected with either ΔHOPEMT asd + YopE1–138 or ΔHOPEMT asd + YopE1–138-tBID reveal the induction of an apoptotic phenotype after tBID delivery. Cells were stained for the nuclei with Hoechst, for F-actin with phalloidin, for tubulin with an anti-tubulin antibody, and for mitochondria with Mitotracker. Bars, 40 µm.

