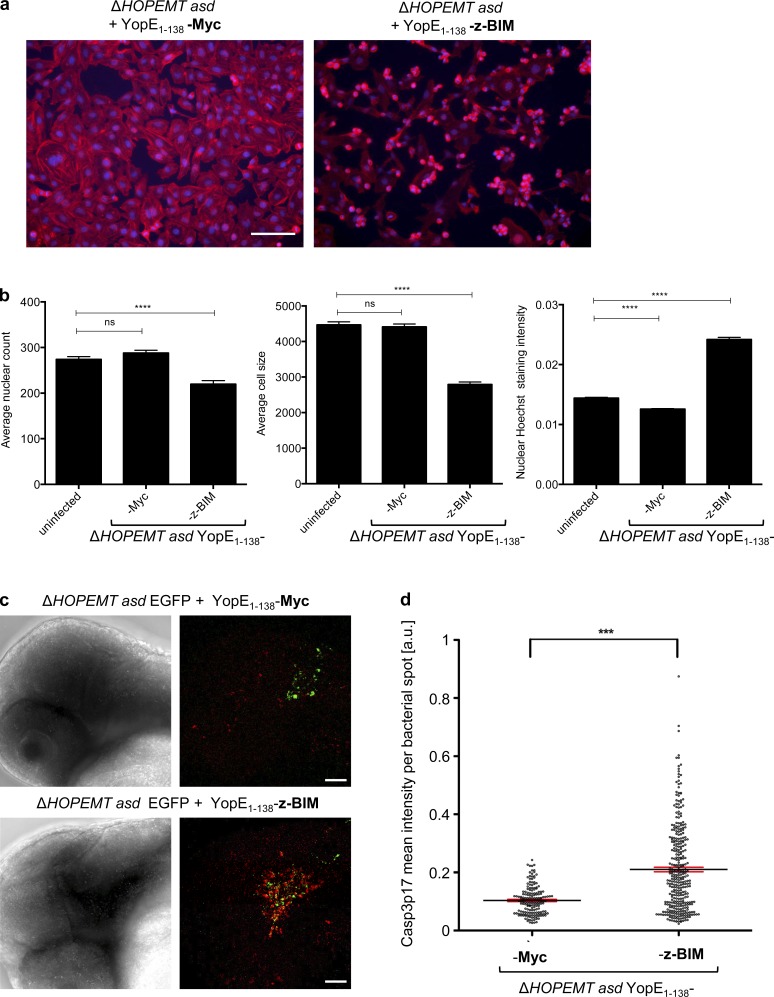
Figure 8.
T3S-dependent delivery of zebrafish BIM induces apoptosis. (a) Translocated z-BIM induces apoptosis in HeLa cells. HeLa cells were infected with the indicated strains at an MOI of 100 for 1 h. After fixation, cells were stained for nuclei (blue) and F-actin (red). Bar, 50 µm. (b) Automated quantification of mean nuclear count, cell size and nuclear staining intensity as marker for nuclear condensation of n = 84 images as in panel a. Error bars indicate standard errors of the mean. Statistical analysis was performed using a Mann-Whitney test (***, P < 0.001; ****, P < 0.0001; ns, not significant). (c) Translocated z-BIM induces apoptosis in zebrafish embryos. Zebrafish embryos were infected with the EGFP-expressing Y. enterocolitica control strain or YopE1–138-z-BIM delivering strain by injecting 400 bacteria into the hindbrain region. After 5.5 h, embryos were fixed, stained for CASP3 p17 subunit (red), and analyzed by fluorescent microscopy for the presence of bacteria (green). Fluorescent images correspond to maximum intensity z projections. Bars, 50 µm. (d) Automated image analysis of maximum intensity z projections of recorded z-stack images as shown in panel c. In brief, bacteria were detected via the GFP channel. Around each bacterial spot, a circle with a radius of 10 pixels was created and CASP3 p17 staining intensity was measured. Statistical analysis was performed using a Mann-Whitney test (***, P < 0.001). Data represent the mean of n = 14 infected embryos for YopE1–138-Myc and n = 19 for YopE1–138-z-BIM, and error bars (red) indicate standard errors of the mean.

