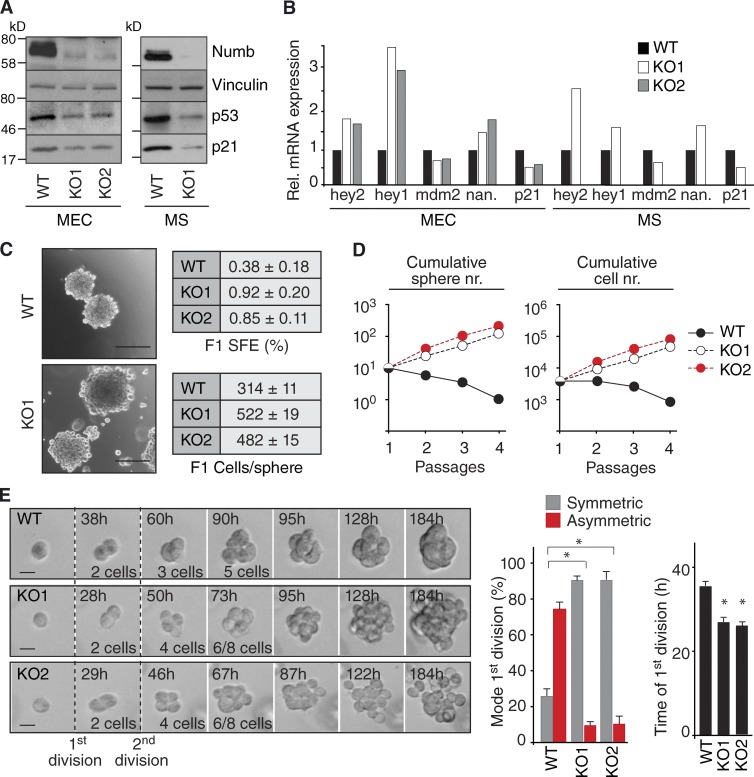
Figure 4.
Numb controls the replicative mode during MS formation. (A) WT and Numb-KO (KO1 and KO2; see Fig. 9 for details) MECs or MS were analyzed by IB. (B) The indicated cells were analyzed by quantitative PCR. Data are from a single experiment run in triplicate and expressed relative to mRNA levels in WT cells (=1). Nan., nanog. (C, left) Representative images of WT and Numb-KO MS. Bar, 100 µm. Right, SFE and size (Cells/sphere) of WT and Numb-KO MS. (D) Cumulative sphere and cell number (nr.) from serial replating of WT and Numb-KO MS. A single representative experiment out of two repeats is shown. (E, left) Representative time-lapse video microscopy of the formation of WT or KO MS. Bar, 10 µm. (right) Quantification of the experiment. The mode and the time of the first division are shown. *, P < 0.05 versus comparable WT condition.

