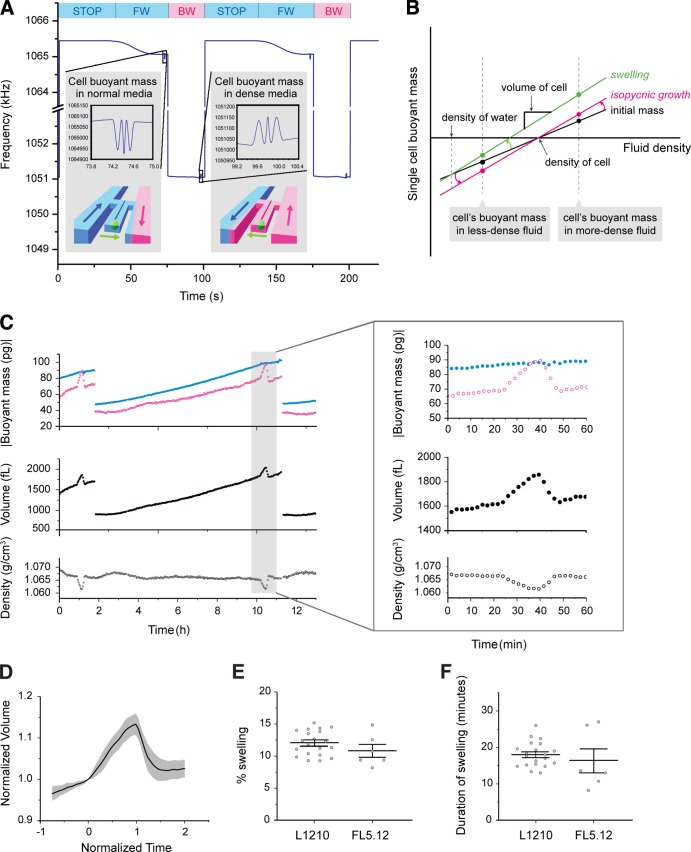
Figure 1.
Measurement of cell volume, mass, and density during mitosis. (A) Frequency of the SMR during the measurement of a cell’s buoyant mass in two different fluids. The color bars and the illustration of the SMR in the inset indicate the fluid surrounding a cell and the direction of its flow within the SMR (blue, normal medium; magenta, dense medium; FW, forward flow; BW, backward flow). Insets show the shift in SMR frequency upon the passage of the cell. Cell buoyant mass was determined by the height of the two side peaks (see SMR in Materials and methods). (B) Mass, volume, and density can be determined by weighing a cell in two fluids of different density and plotting the linear relationship between buoyant mass and fluid density. For isopycnic growth (from black line to magenta line), the absolute value of buoyant mass increases proportionally. For swelling (from black line to green line), the buoyant mass in the dense medium significantly increases, whereas the buoyant mass in the normal medium remains almost constant. (C) Buoyant mass measured in normal and dense medium and the resulting volume and density of the same cell measured over the complete cell cycle and during mitosis (inset). After division, only one of the daughter cells is retained in the flow trap. (D) Mean trajectory of L1210 cell volume during mitosis. Volume is normalized by the volume at the onset of swelling. The gray area indicates SD. The time is aligned such that the swelling starts at 0 and ends at 1. n = 20. See Fig. S2 A for single-cell data. (E) Magnitude of swelling during mitosis of L1210 (n = 20, SEM = 0.42) and FL5.12 (n = 6, SEM = 0.92) cells. (F) Duration of swelling during mitosis of L1210 (n = 20, SEM = 0.75) and FL5.12 (n = 6, SEM = 3.0) cells. See Fig. S2 B for single-cell data.

