Figure 2.
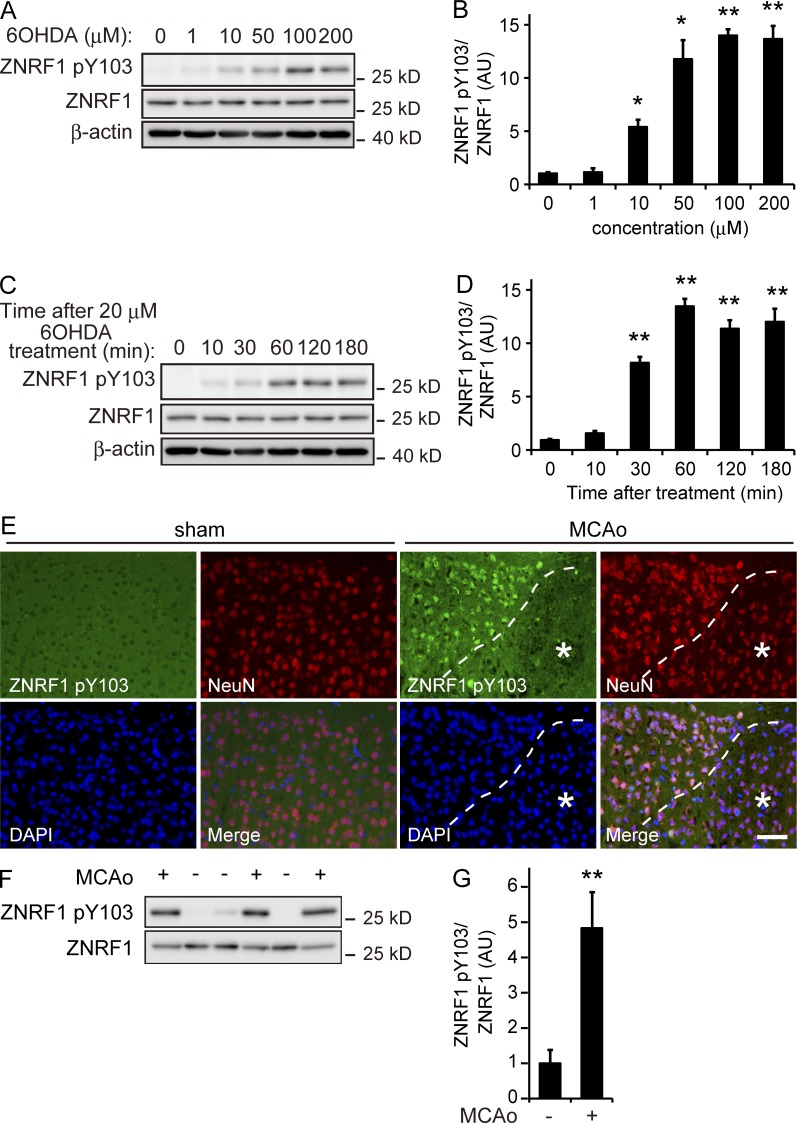
ZNRF1 is phosphorylated at Y103 in response to oxidative stress. (A and B) ZNRF1 pY103 in primary cultured cortical neurons is dose-dependently induced by 6OHDA. Shown are representative immunoblots (A) and quantified expression levels for ZNRF1 pY103 normalized to total ZNRF1 relative to the control (B; labeled as 0; n = 5). (C and D) Time-dependent increases in ZNRF1 pY103 in 6OHDA-treated neurons. Shown are representative immunoblots (C) and quantified expression levels for ZNRF1 pY103 normalized to ZNRF1 relative to the control (D; labeled as 0). n = 5. (E) ZNRF1 pY103 immunoreactivity in neurons in the MCAo model. The region with a reduced number of NeuN-positive neurons in the MCAo cortex was considered to be the infarct core (indicated by asterisks). Dashed lines indicate the border between the ischemic penumbra and infarct core. Bar, 50 µm. (F and G) ZNRF1 pY103 immunoreactivity in the MCAo brain lysate. Cell lysates were prepared from serial sections of MCAo (+) or sham control (−) and subjected to an immunoblot analysis. Each lane represents brain tissue samples from different animals (F). Quantified levels of ZNRF1 pY103 normalized to ZNRF1 relative to the sham control are shown (G; n = 3 in each group). Data are presented as the mean ± SEM. Significant differences from the control (*, P < 0.05; **, P < 0.01) were determined by a one-way ANOVA with Tukey’s post-hoc test in B and D or two-tailed Student’s t test in G. AU, arbitrary units.

