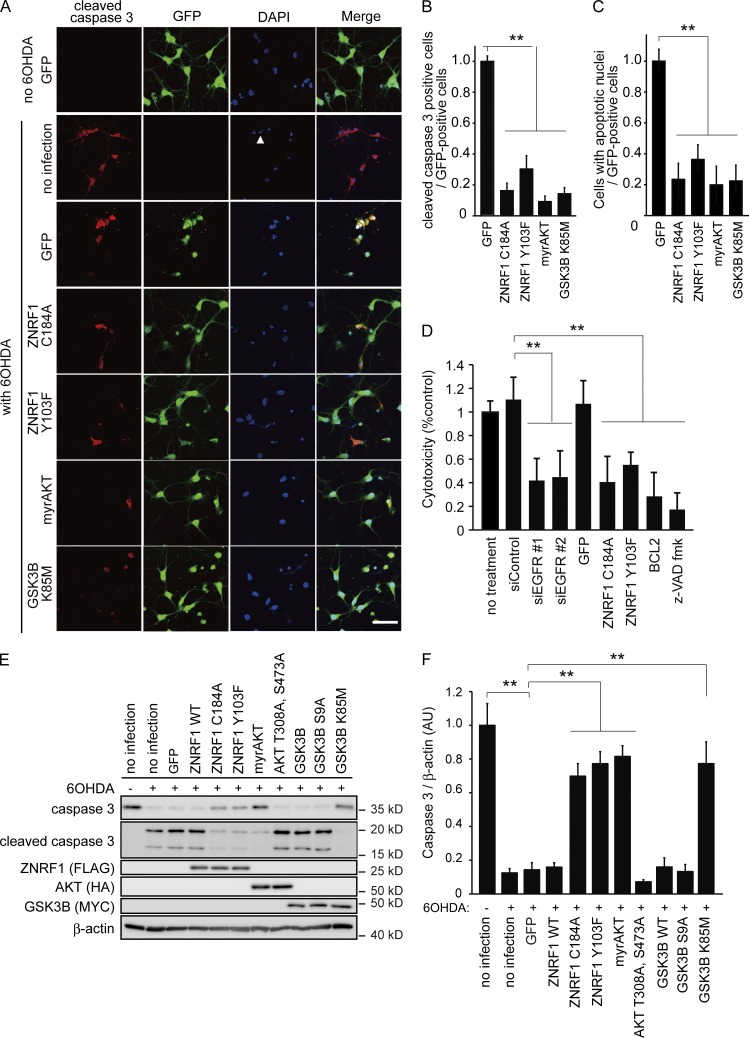
Figure 5.
Inhibition of ZNRF1 ubiquitin ligase activity protects primary cultured cortical neurons from 6OHDA-induced apoptosis. (A–F) Cleaved caspase 3 expression was assessed in cultured cortical neurons overexpressing AKT, GSK3B, ZNRF1, or their indicated mutants by immunofluorescence. The contribution of apoptosis to ZNRF1-elicited signaling-mediated cell death was assessed by an LDH assay in D. An immunoblot analysis for caspase 3 and cleaved caspase 3 was also performed (E and F). (A) Representative photomicrographs for cleaved caspase 3 immunostaining are shown. Cellular nuclei were counterstained with DAPI. The arrowhead indicates one of the apoptotic nuclei exhibiting highly fluorescent condensed chromatin. Bar, 100 μm. Note that all cells in the photomicrographs labeled as “no 6OHDA GFP” expressed GFP, suggesting that transfection efficiency was ∼100%. (B) The ratios of the cleaved caspase 3–positive cell number to the total number of GFP-positive cells (i.e., the number of transgene-expressing cells) for each condition are shown relative to the ratio under the GFP-only expressing condition. (C) The ratios of cell numbers with apoptotic nuclei to the total number of GFP-positive cells for each condition are shown relative to the ratio under the GFP-only expressing condition. (D) The protective effects of the inhibition of ZNRF1 signaling against neuronal cell death by 6OHDA were quantitatively assessed by an LDH release assay using primary cultured cortical neurons. Quantified levels for LDH activity in culture media from each condition relative to the no treatment control are shown. Note that the inhibition of ZNRF1 signaling exerted protective effects against neuronal cell death, similar to that caused by the inhibition of apoptosis with the overexpression of BCL2 or the z-VAD fmk treatment, suggesting that the inhibition of ZNRF1-elicited signaling protects 6OHDA-treated neurons from apoptosis. (E and F) Representative immunoblots (E) and quantified expression levels for caspase 3 normalized to β-actin relative to the no infection control without the 6OHDA treatment (F) are shown. Data are presented as the mean ± SEM. n = 5. Significant differences from the control (**, P < 0.01) were determined by a one-way ANOVA with Tukey’s post-hoc test. AU, arbitrary units.

