
Fig. 7.
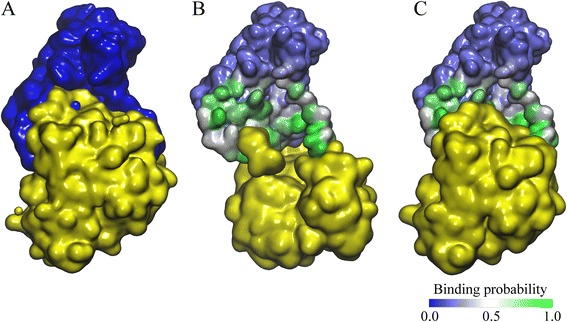
Model ranking for ARAT homo-dimer. The experimental complex structure is shown in (a) with the chain A colored in blue and the chain B colored in yellow. The top ranked models by ZDOCK and eRankPPI are shown in (b) and (c), respectively. In b, c, the surface of the chain A is colored according to interface probability estimated by eFindSitePPI with the scale given in the bottom right corner (blue/white/green for the high/intermediate/low probability)