
Fig. 7.
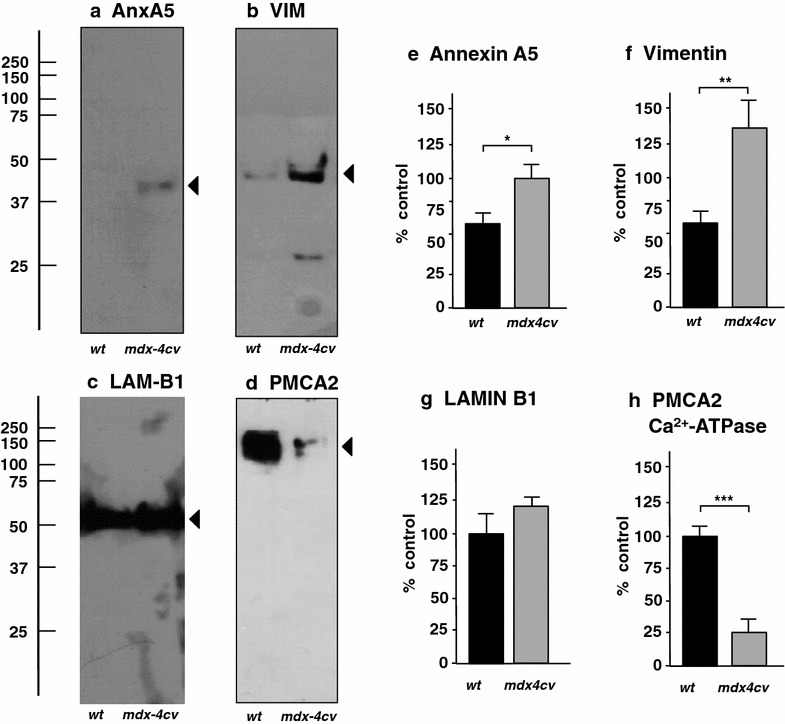
Comparative immunoblot analysis of normal versus mdx-4cv brain. Shown are representative immunoblots (a–d) of key proteomic hits identified by mass spectrometric analysis. Lanes 1 and 2 represent total extracts from control wild type (wt) and mdx-4cv brain, respectively. Blots were labelled with antibodies to the AnxA5 isoform of annexin (a), the intermediate filament protein vimentin (VIM) (b), the nuclear envelope protein lamin B1 (LAM-B1) (c) and the plasma membrane Ca2+-ATPase isoform PMCA2 (d). Arrowheads mark the main immuno-labelled protein bands in individual panels. Graphical representations of the immuno-decoration levels are shown in panels e–h: Student’s t-test, unpaired; n = 4; *p < 0.05; **p < 0.01; ***p < 0.001