Fig. 2.

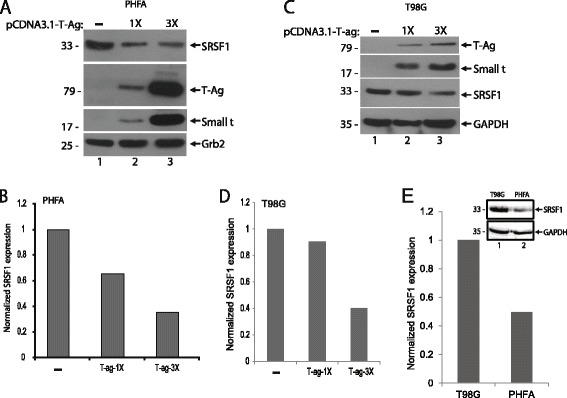
T-Antigen suppresses SRSF1 expression in glial cells. a. PHFA cells were transfected with increasing concentration of T-antigen expression plasmid. After 48 h post-transfection, whole cell protein extracts were collected. Western blot analyses were performed to detect levels of SRSF1, T-antigen, and small t antigen expressions. Grb2 served as a loading control. b. Bar graph representation of relative SRSF1 expression from panel a. Quantification of the intensity of the bands of SRSF1 from panel a were normalized to Grb2 band intensities and used to calculate relative expression. c. T98G cells were transfected with increasing concentration of T-antigen expression plasmid. After 48 h post-transfections, whole cell protein extracts were collected. Western blot analyses were performed to detect levels of SRSF1, T-antigen, and small t antigen expressions. GAPDH served as a loading control. d. Bar graph representation of relative SRSF1 expression from panel c. Quantification of the intensity of the bands of SRSF1 were normalized to GAPDH band intensities and used to calculate relative SRSF1 expression levels. e. Whole cell protein lysates from PHFA and T98G cells were prepared and analyzed by Western blotting for the detection of SRSF1 expression. GAPDH served as a loading control. Band intensity of the bands of SRSF1 were quantified, normalized to GAPDH, and shown as bar graph
