
Fig. 2.
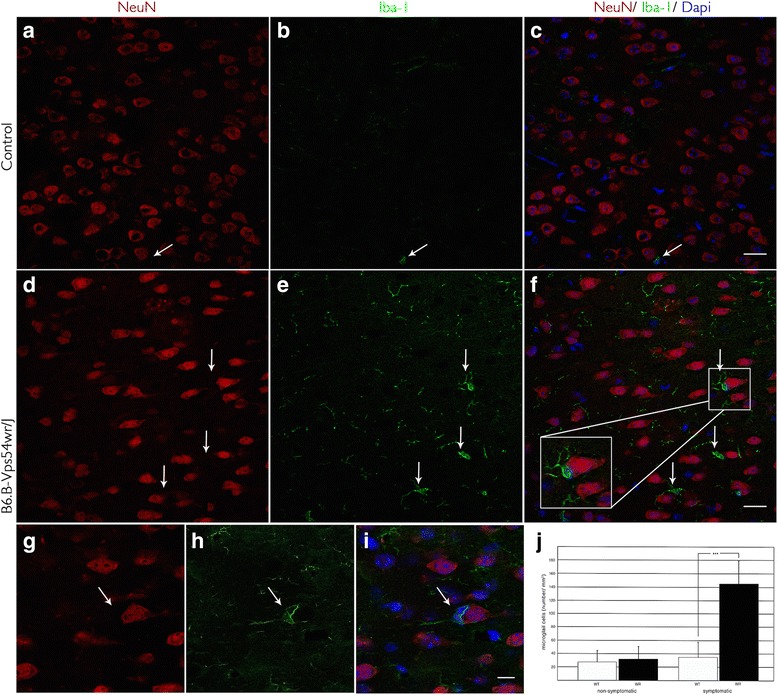
Visualization of Iba-1-labeled microglial cells in the motor cortex tissue of WR and WT mice 40 d.p.n. a–c Relation of activated microglial cells (green) and neurons labeled with neuronal nuclei antibody (red) in healthy brain tissue of WT mice. d–f Increased level of microglial cells (green) in affected and symptomatic WR mice. Magnification (f) shows the typical slender microglial processes (green) and the phagocytosis of a neuronal cell (red). Scale bar = 20 μm. g–i Phagocytosis of a degenerating neuron (red) by a microglial cell (green). Scale bar = 10 μm. j Increased number/mm2 of microglial cells in the motor cortex during the progression of the disease. Error bars represent SD ±