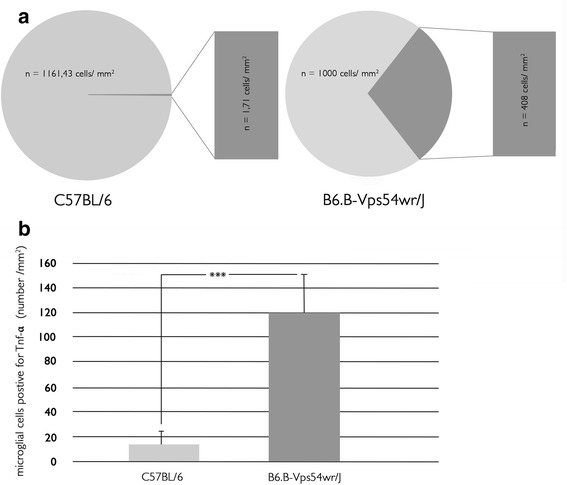
Fig. 4.

Quantification of caspase 3- and TNF-α-positive cells in the motor cortex of WR and WT mice. a A plot of density of caspase 3-positive neuronal cells in the motor cortex of WR and WT mice 40 d.p.n. b The number of microglial cells positive for TNF-α in the motor cortex of WR mice 40 d.p.n is significantly increased. Data are shown as mean ±SD; p < 0.001
