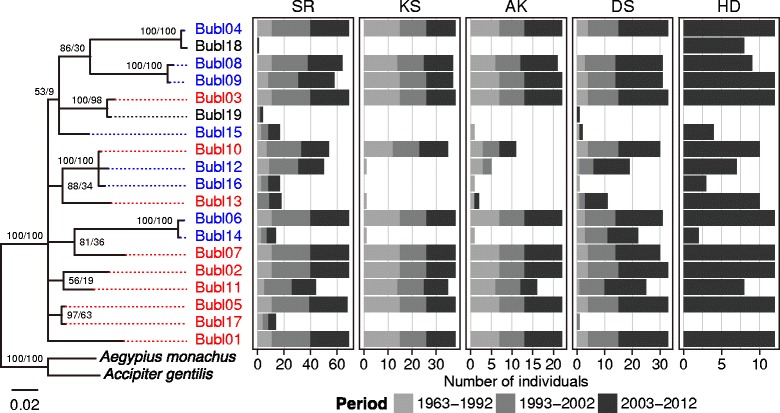
Figure 2.

Phylogenetic relationship and spatio-temporal distribution of fish owl MHC class IIβ allleles. Fifty percent majority-rule Bayesian consensus tree of fish owl MHC class IIβ alleles Bubl01–19 (leftmost of the figure) were constructed under Kimura 2-parameter model with gamma-distributed rate variation among sites using MrBayes. Sequences of the MHC class IIβ alleles of northern goshawk (Accipiter gentilis; EF370917) and Eurasian black vulture (Aegypius manachus; EF370890) were included as outgroups. Numbers at nodes are Bayesian popstrior porobabilities (left) and ML bootstrap support values (right) for MrBayes and GARLI analyses. Alleles obtained from cDNA samples are shown in red, and that obtained from genomic DNA but not in cDNA are shown in blue. Alleles whose expression status are unknown are shown in black. The scale bar indicates branch length in substitutions per site. Bar charts on the right side of the tree show spatial and temporal distribution of the alleles. Population abbreviations: SR, Shiretoko; KS, Konsen; AK, Akan; DS, Daisetsu; HD, Hidaka.
