
Figure 4.
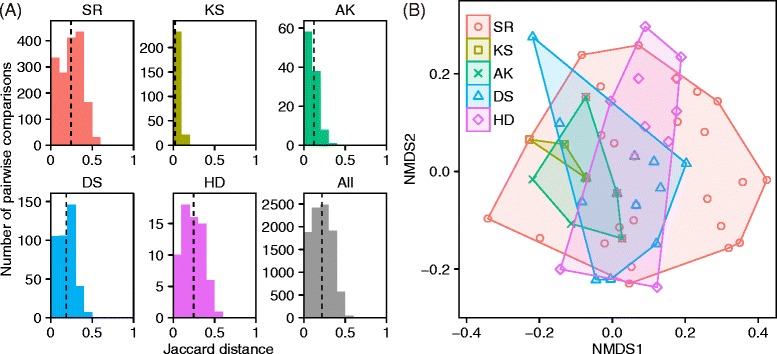
Spatial patterns of MHC diversity in current populations of Blakiston’s fish owl. (A) Frequency distribution of the Jaccard distance between individuals, calculated for each population using the samples collected from 1993 to 2012. Dashed lines indicate mean values. (B) Non-metric multidimensional scaling (NMDS) plot based on Jaccard distances, showing the relationships of individual MHC genotypes among populations. Population abbreviations: SR, Shiretoko; KS, Konsen; AK, Akan; DS, Daisetsu; HD, Hidaka.