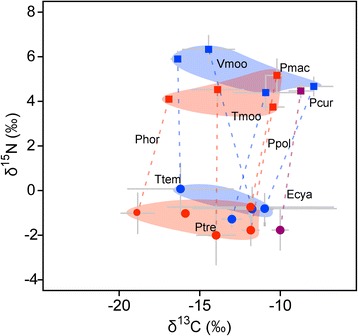
Figure 3.

δ13C-δ15N map for herbivorous cichlids (square plots) and their algal farms (circle plots). The same species pair is connected by a broken line. Abbreviations of cichlid species are shown in Table 1. Red, blue, and purple plots indicate each ecomorph, grazer, browser, and scraper, respectively. Error bars indicate standard deviations.
