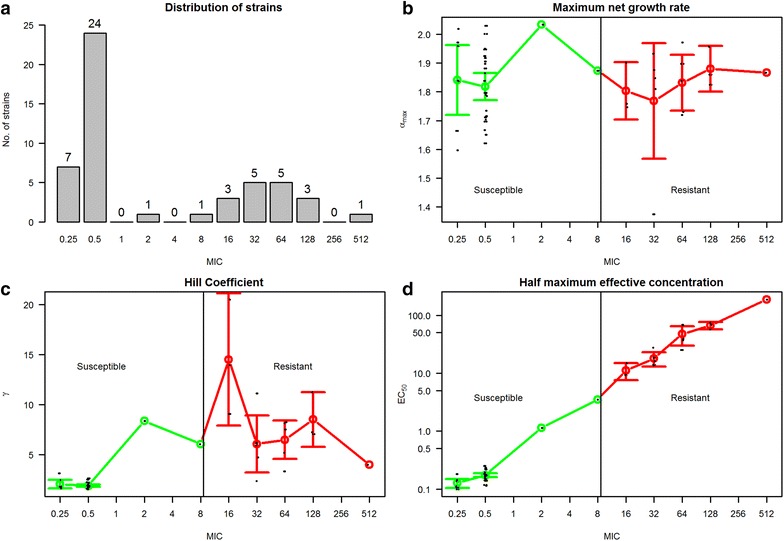
Fig. 3.

a Distribution of 50 E. coli strains according to MIC values. b–d Three PD parameters from E max model of 50 E. coli strains according to their MIC values with mean and 95 % confidence interval. The green line represents susceptible isolates and the red line represents resistant isolates. A vertical black line is drawn at cut-off between susceptible and resistant isolates
